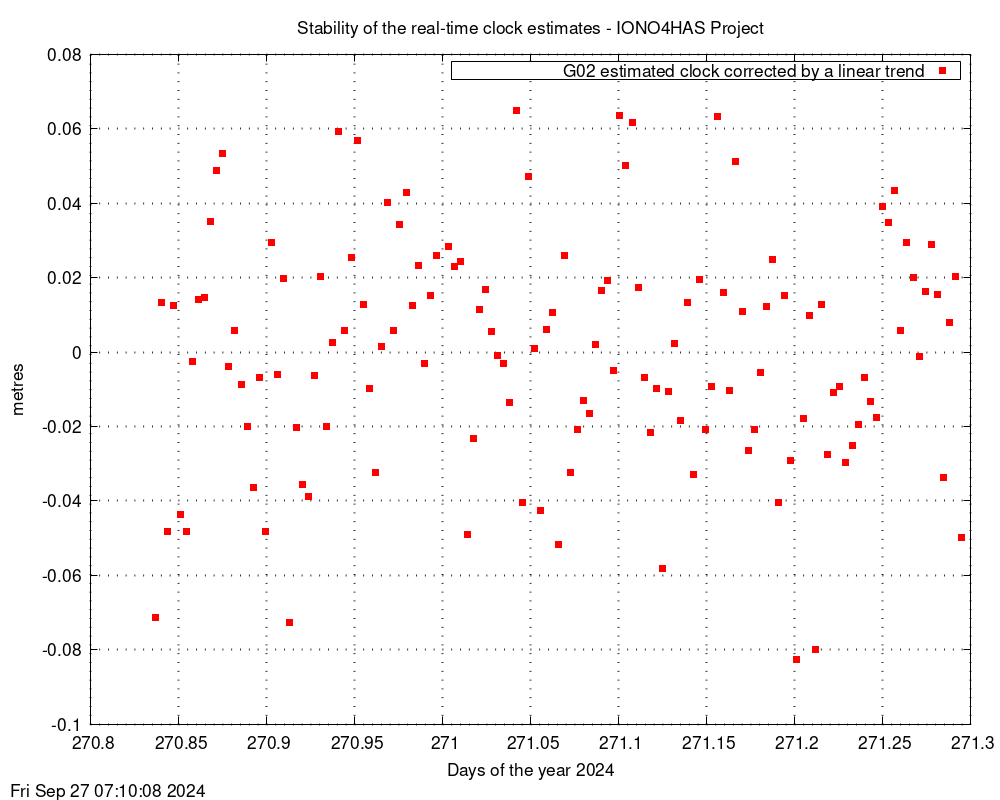
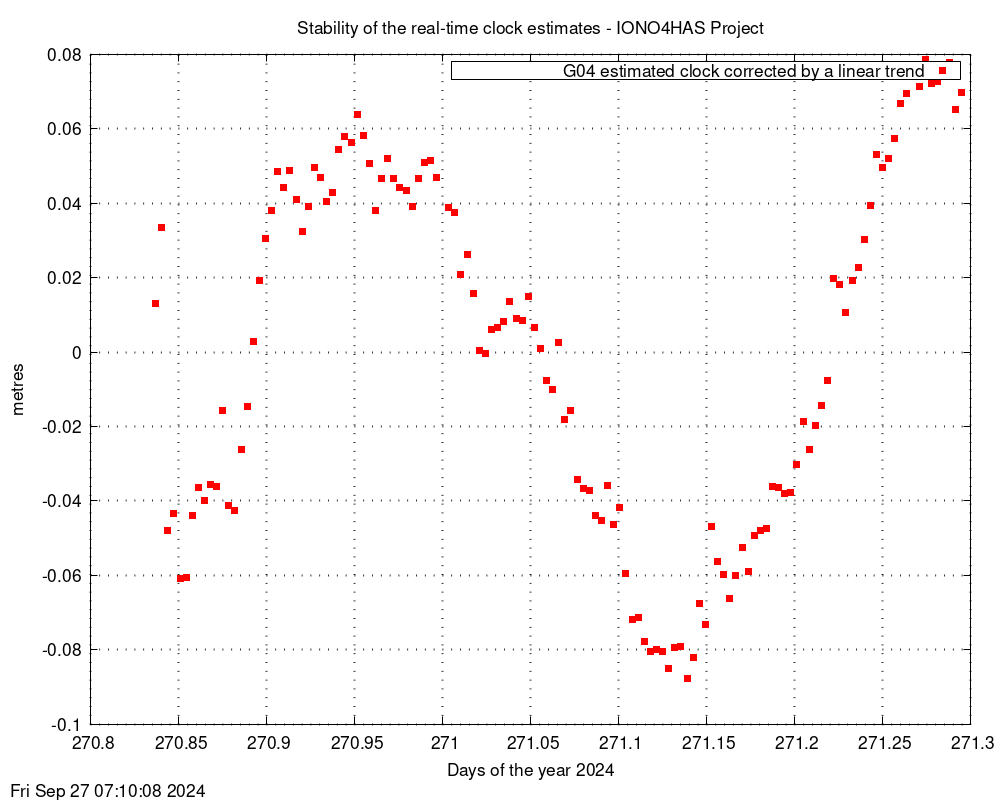
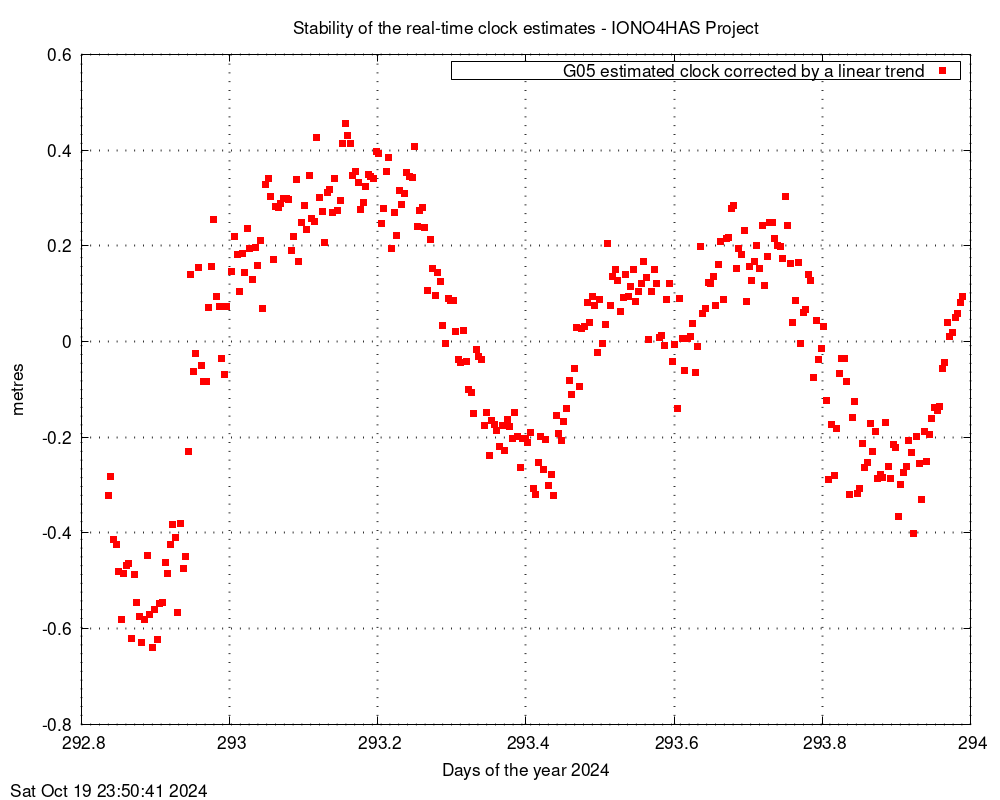
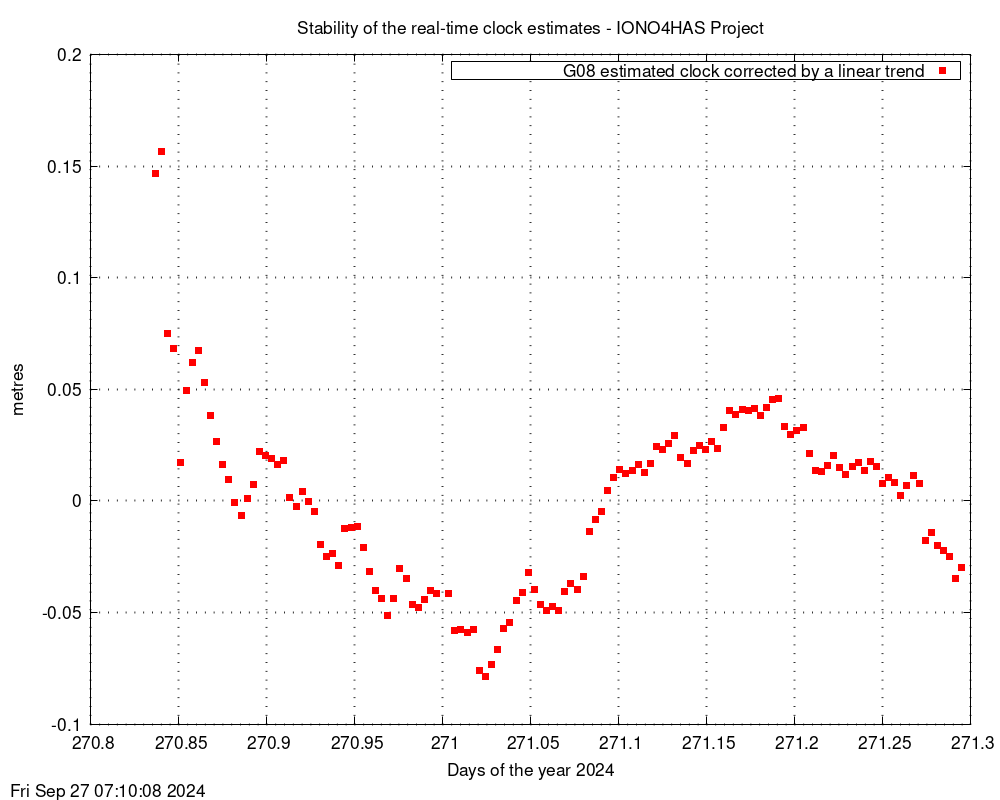
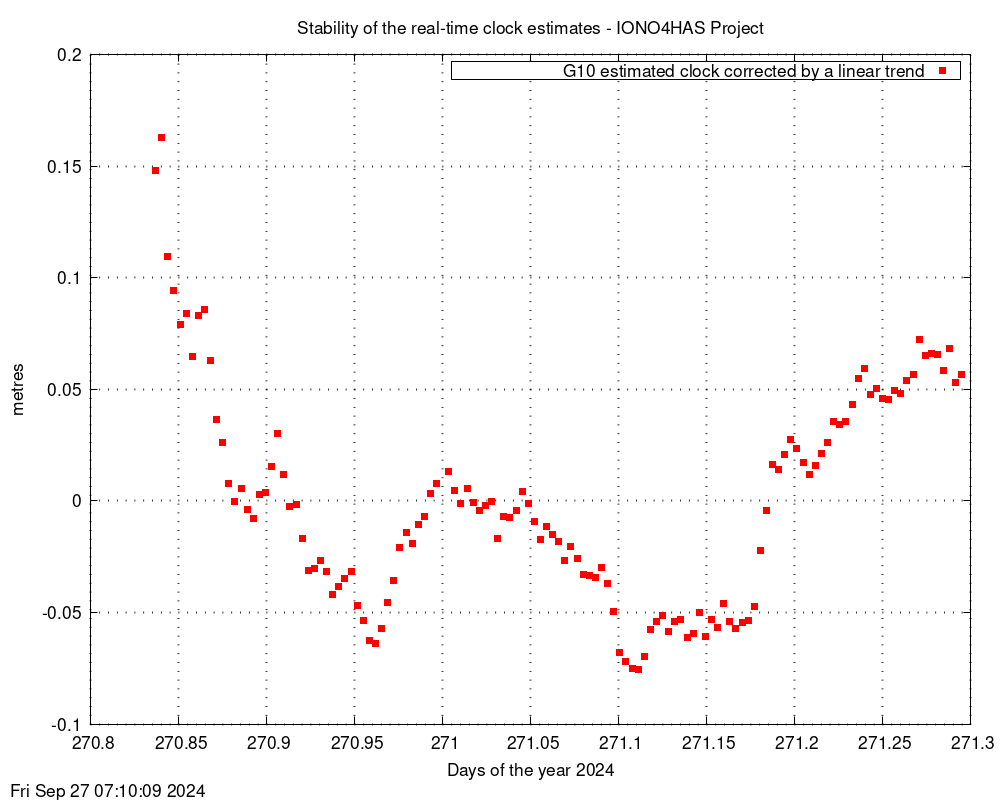
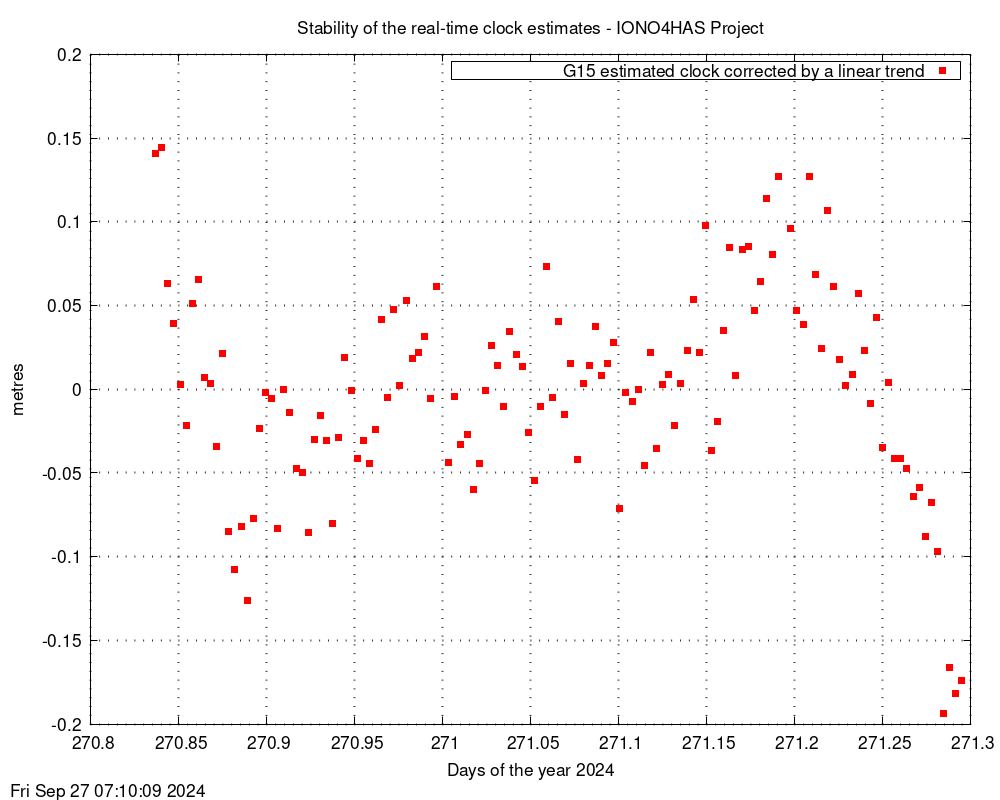
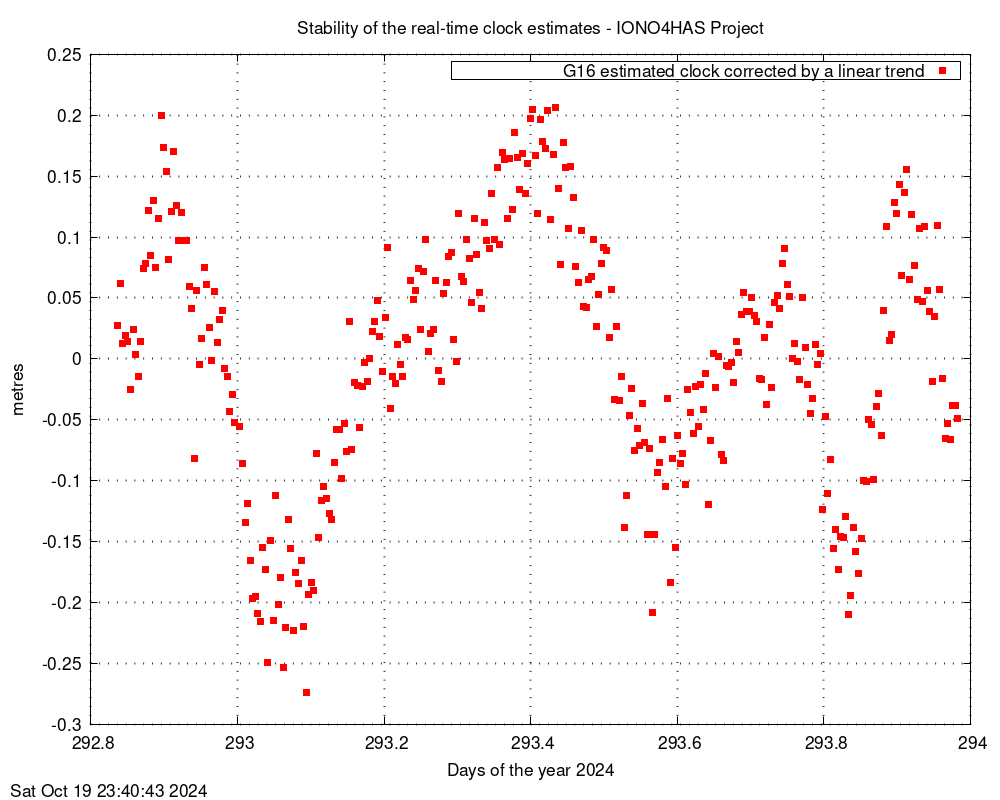
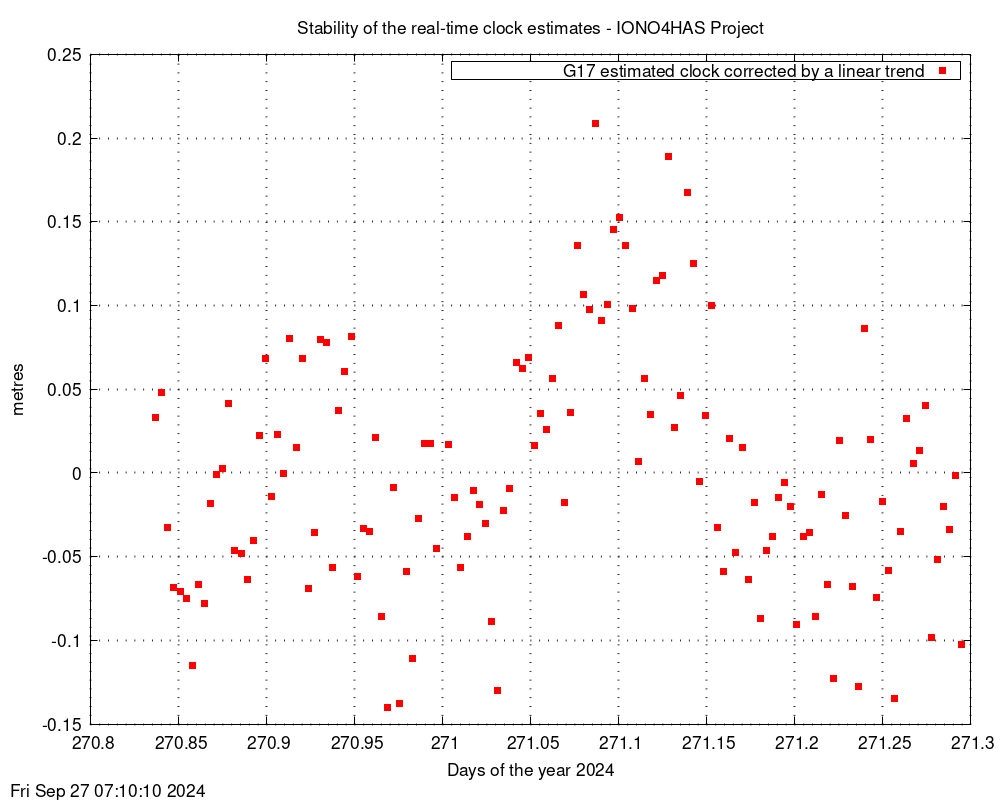
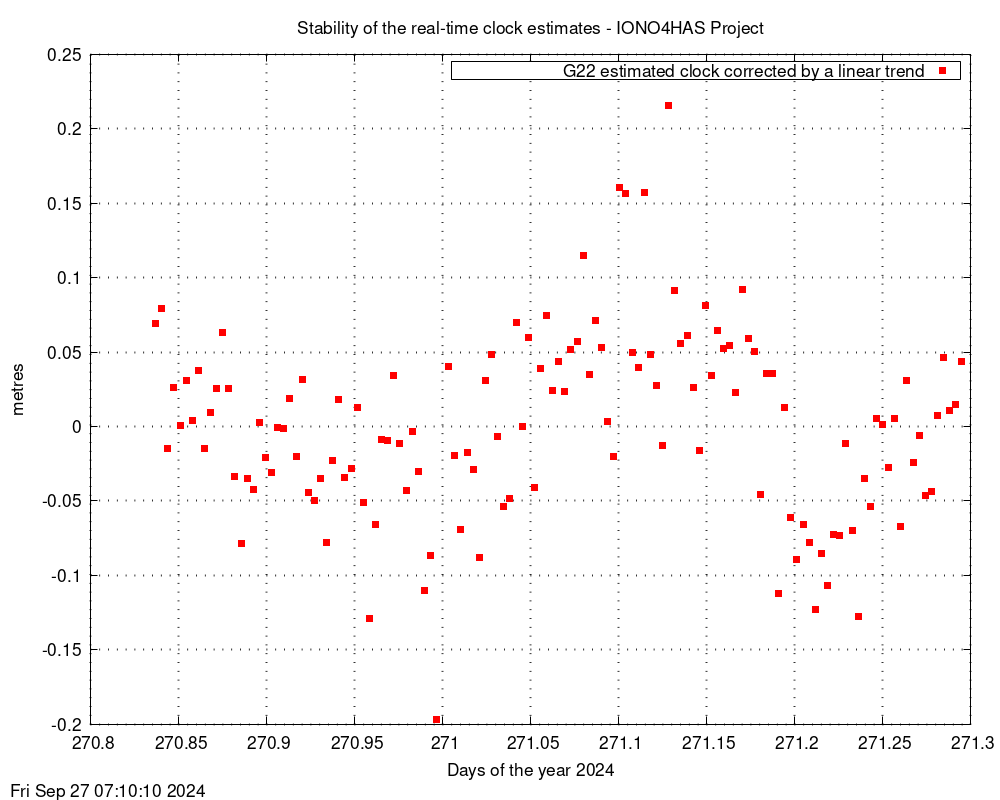
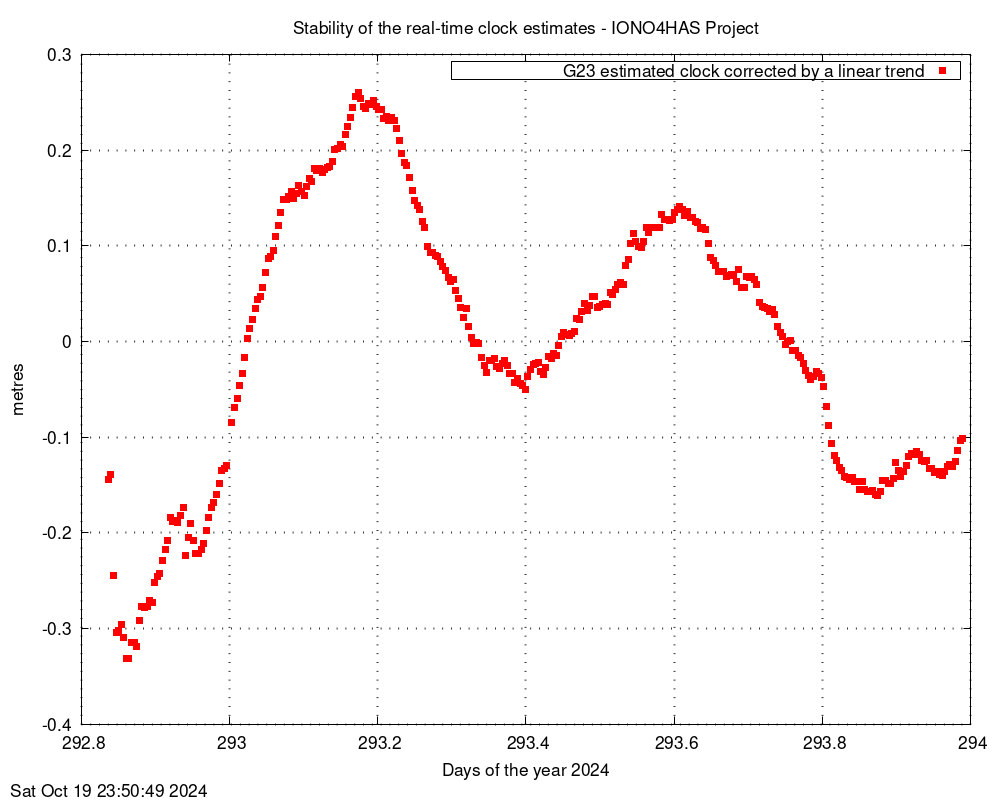
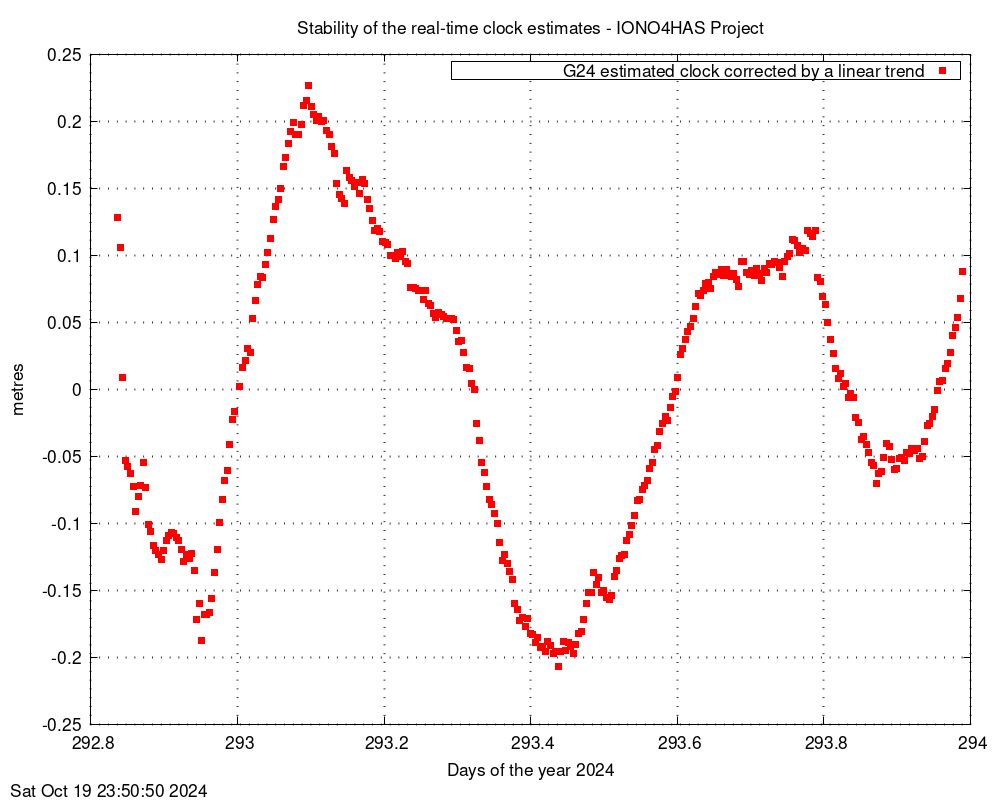
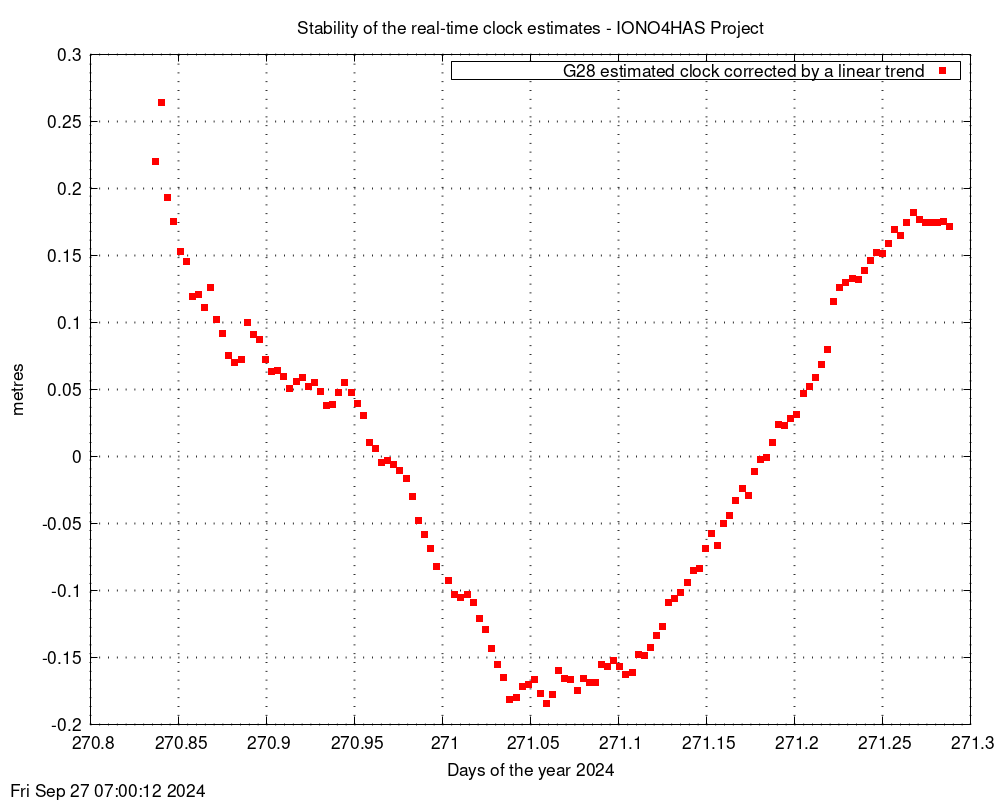
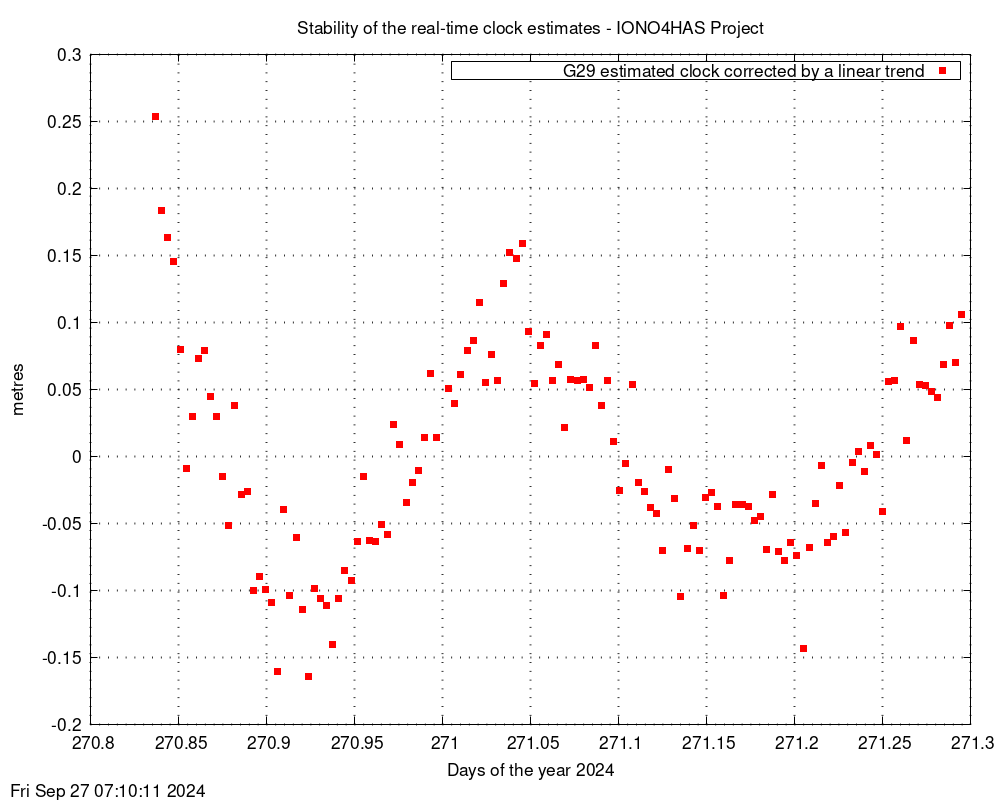
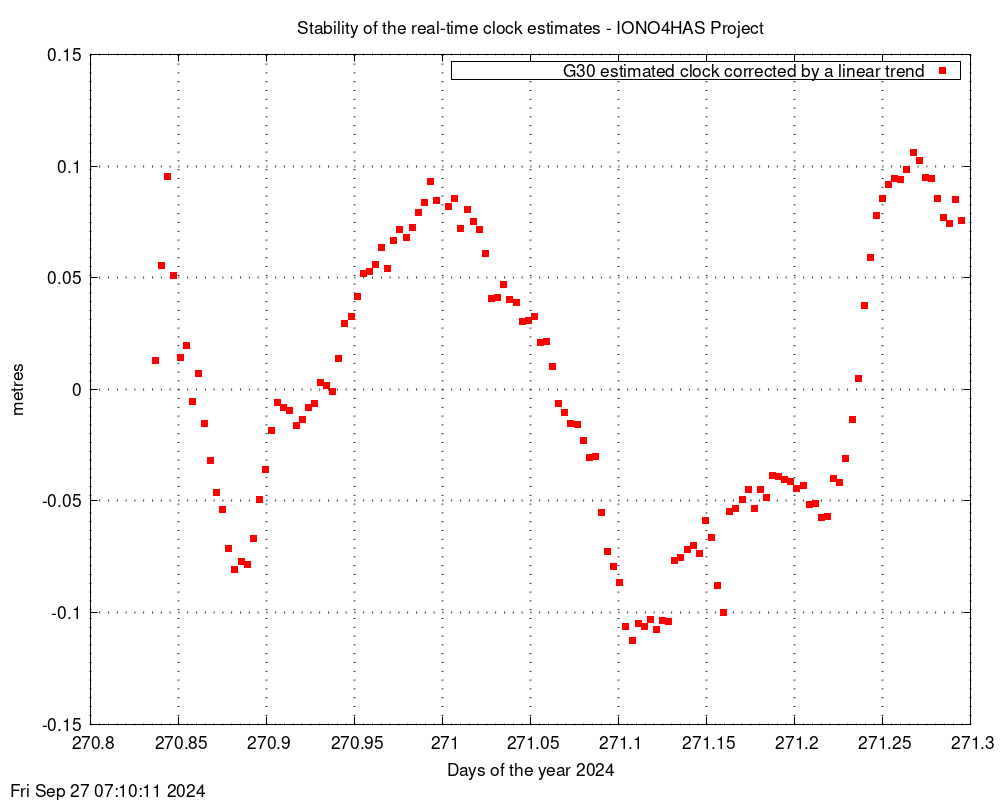
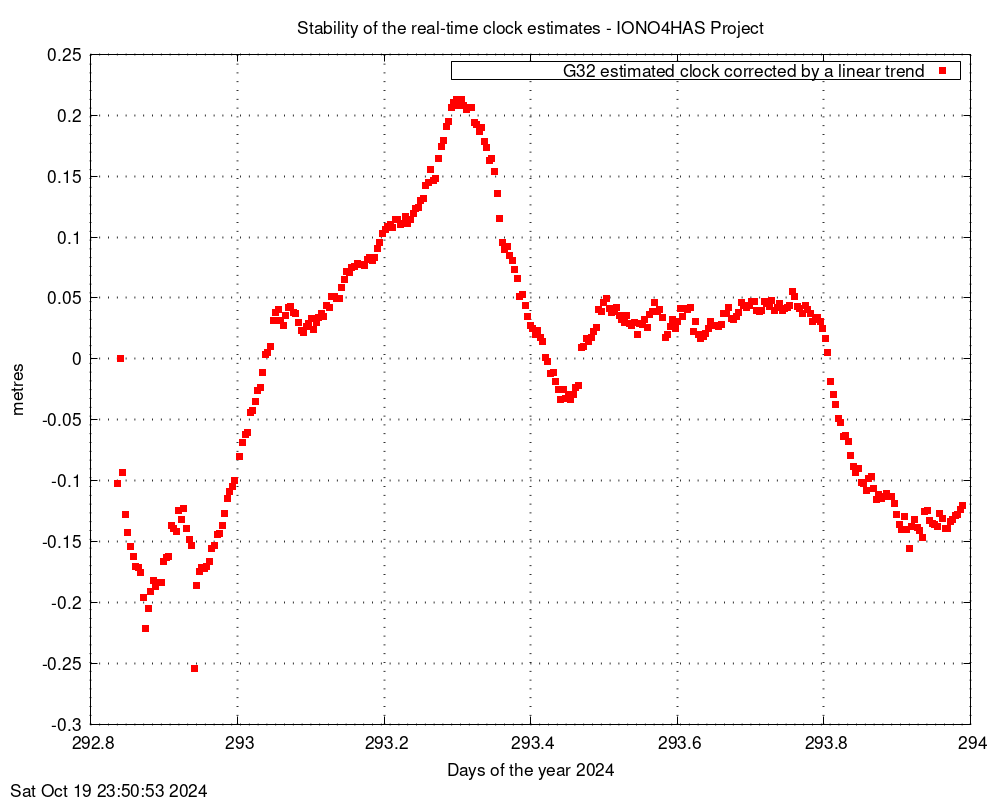
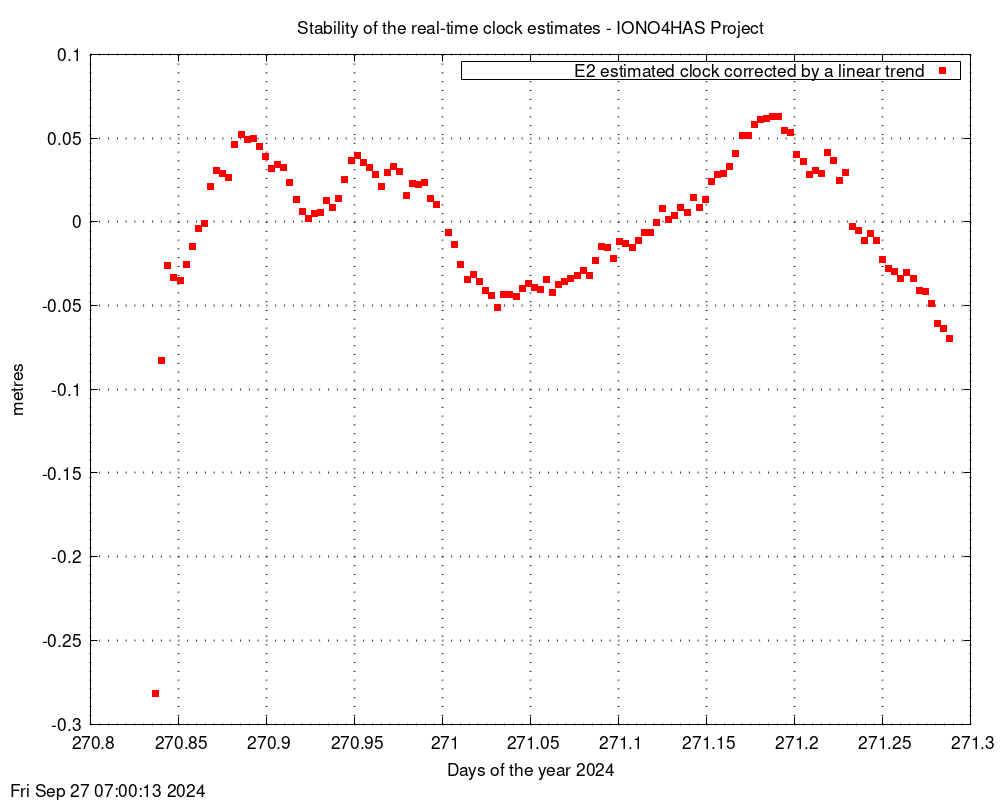
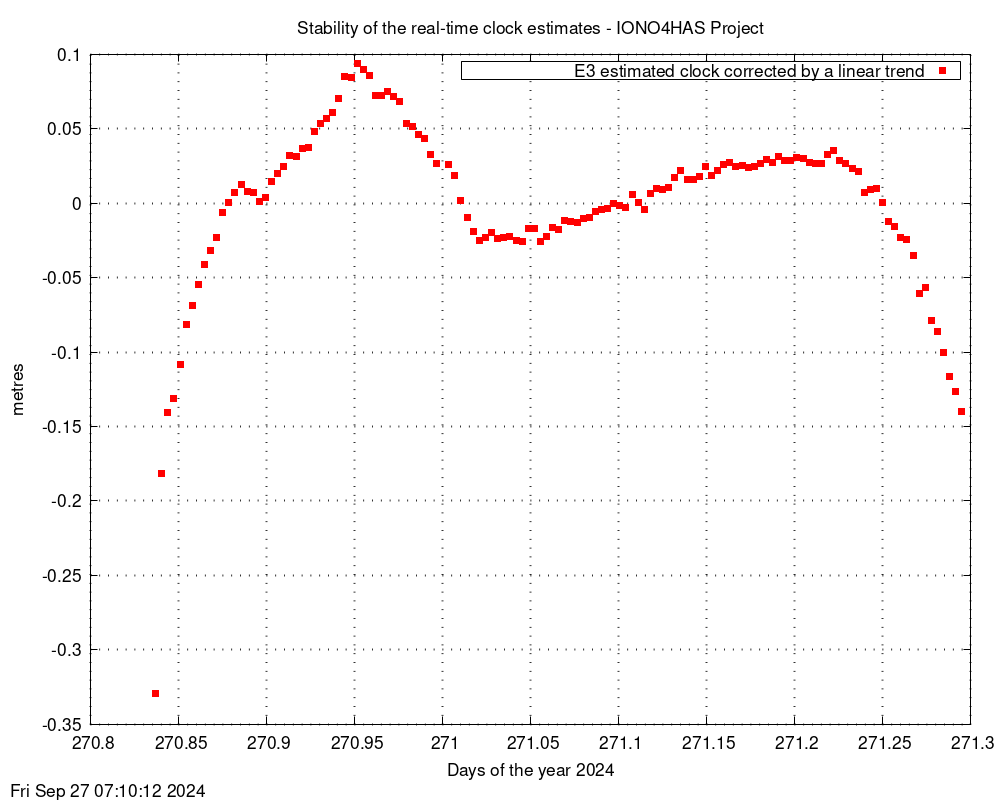
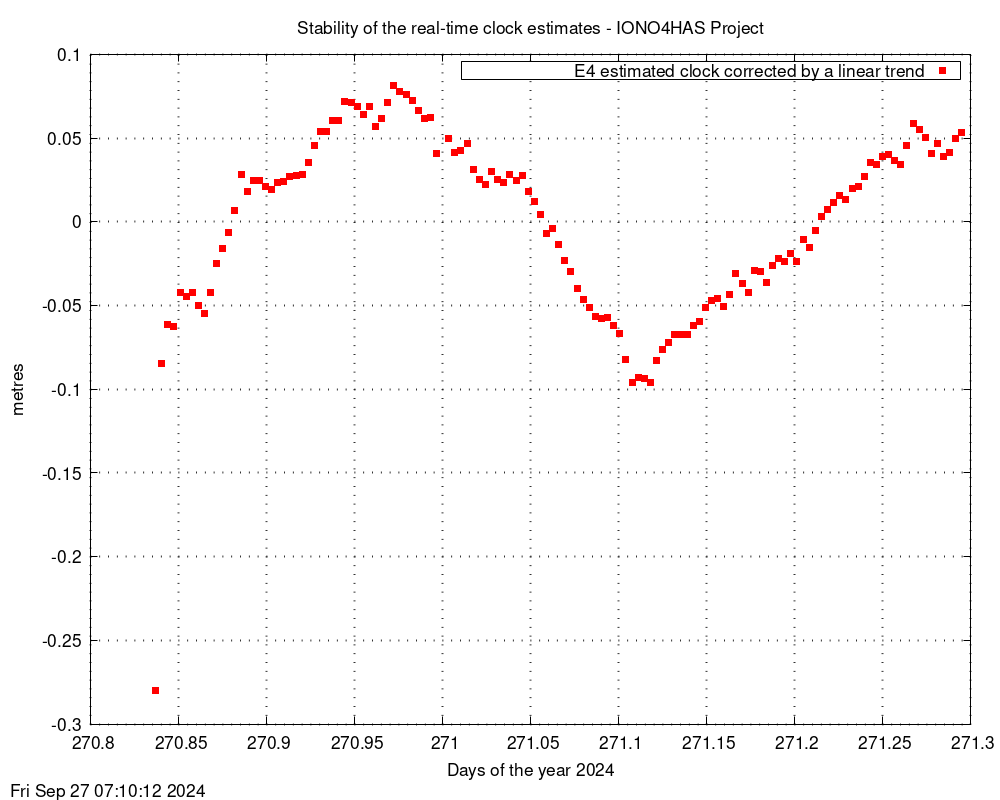
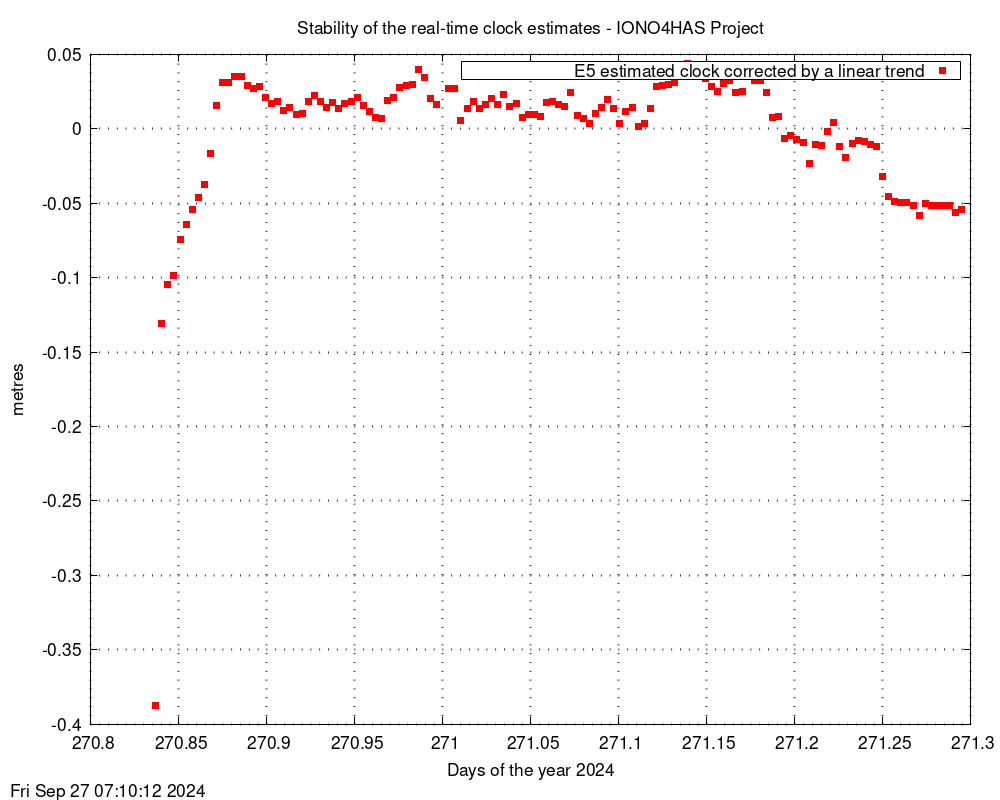
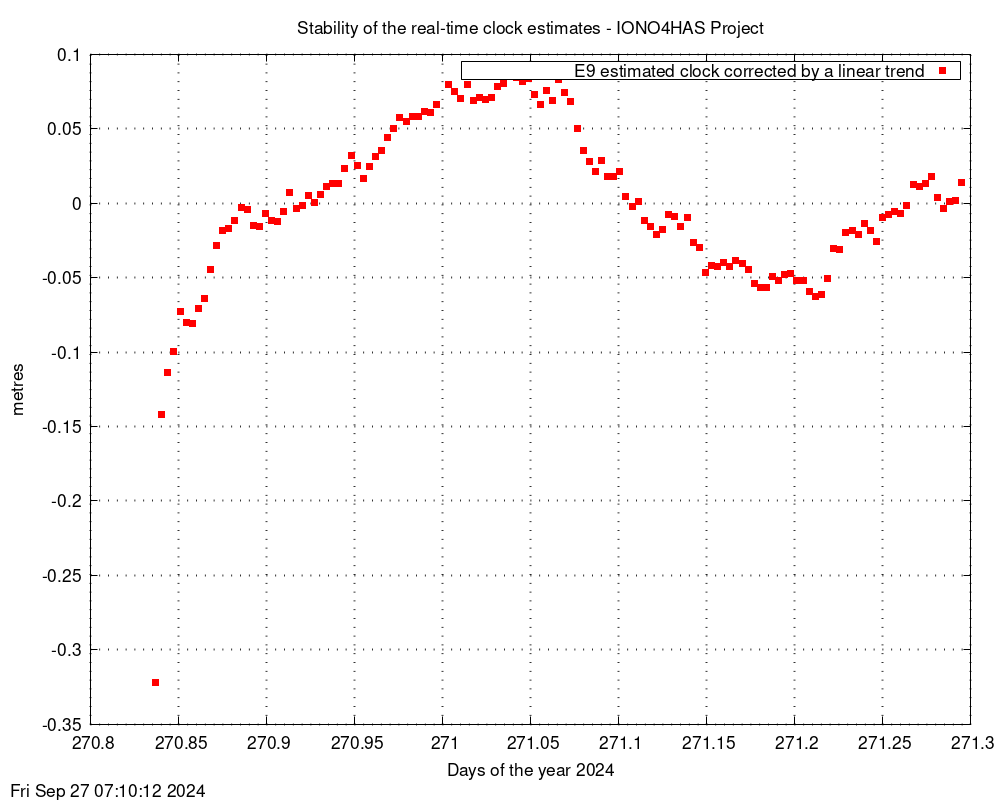
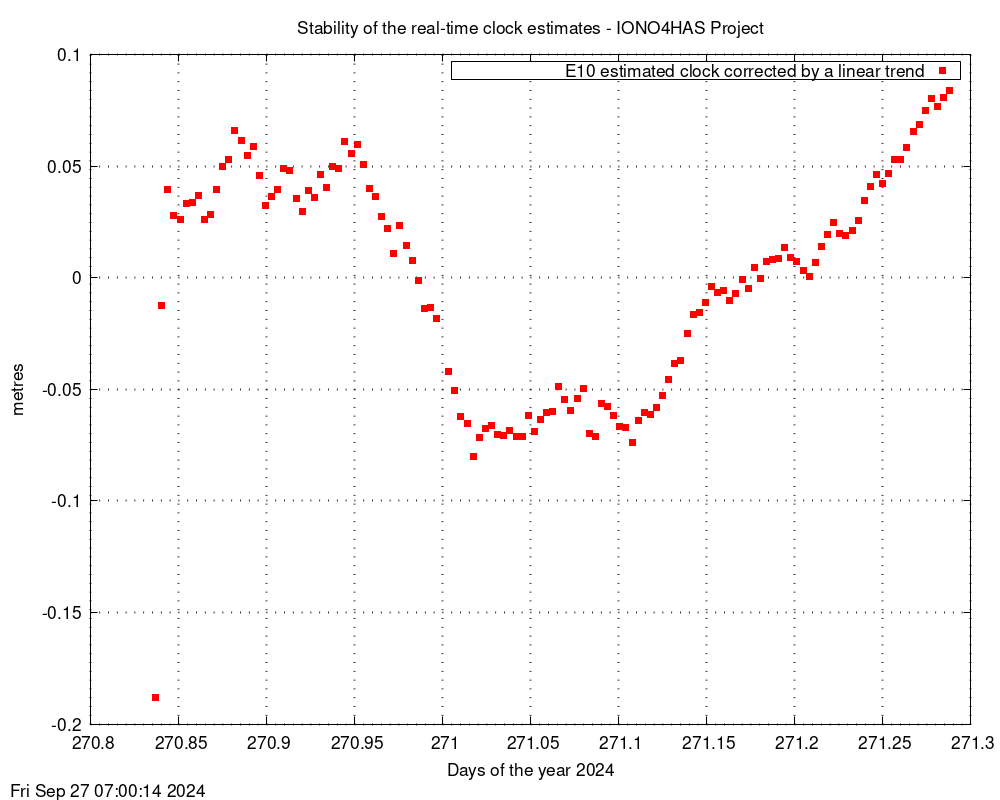
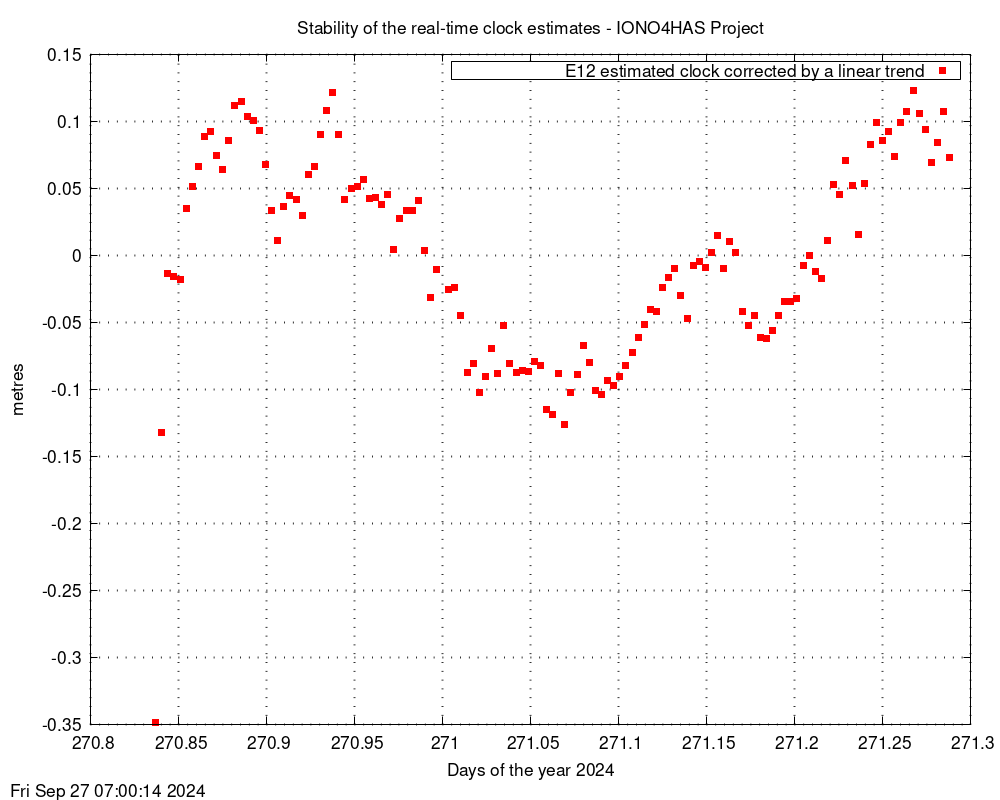
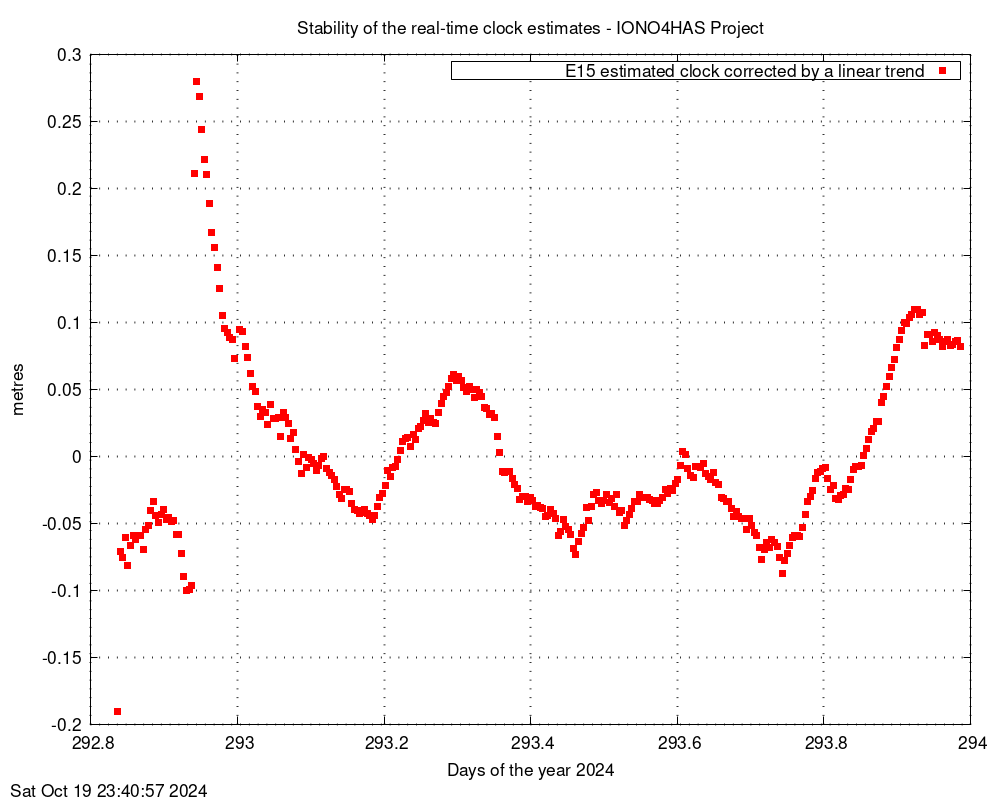
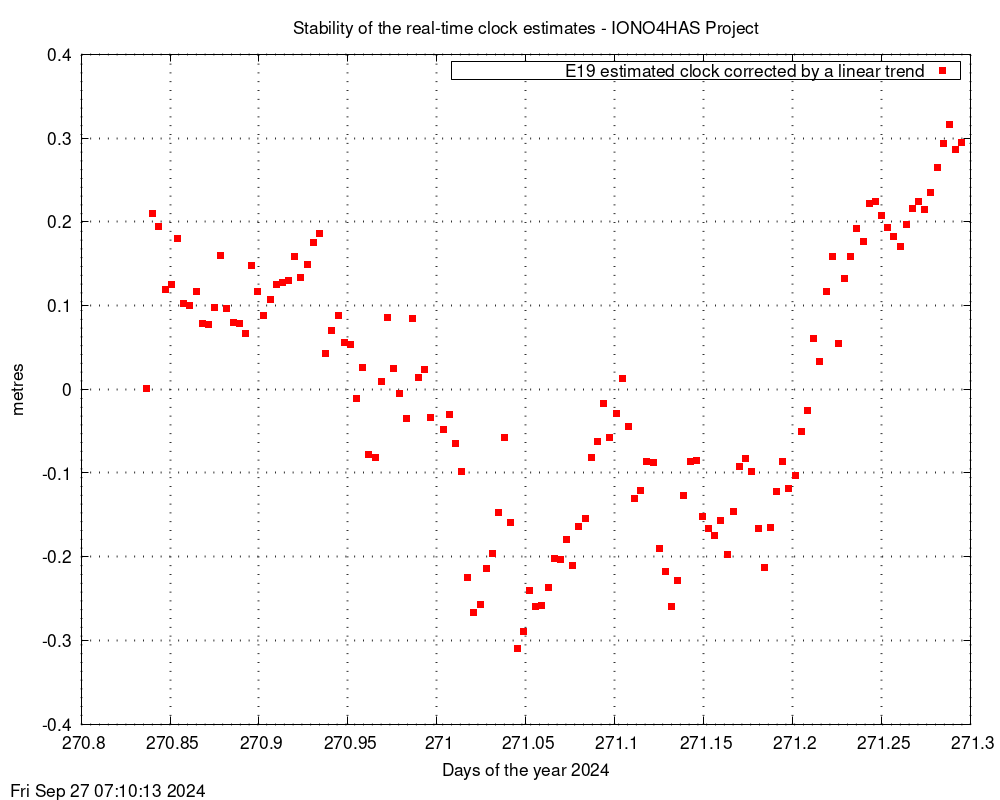
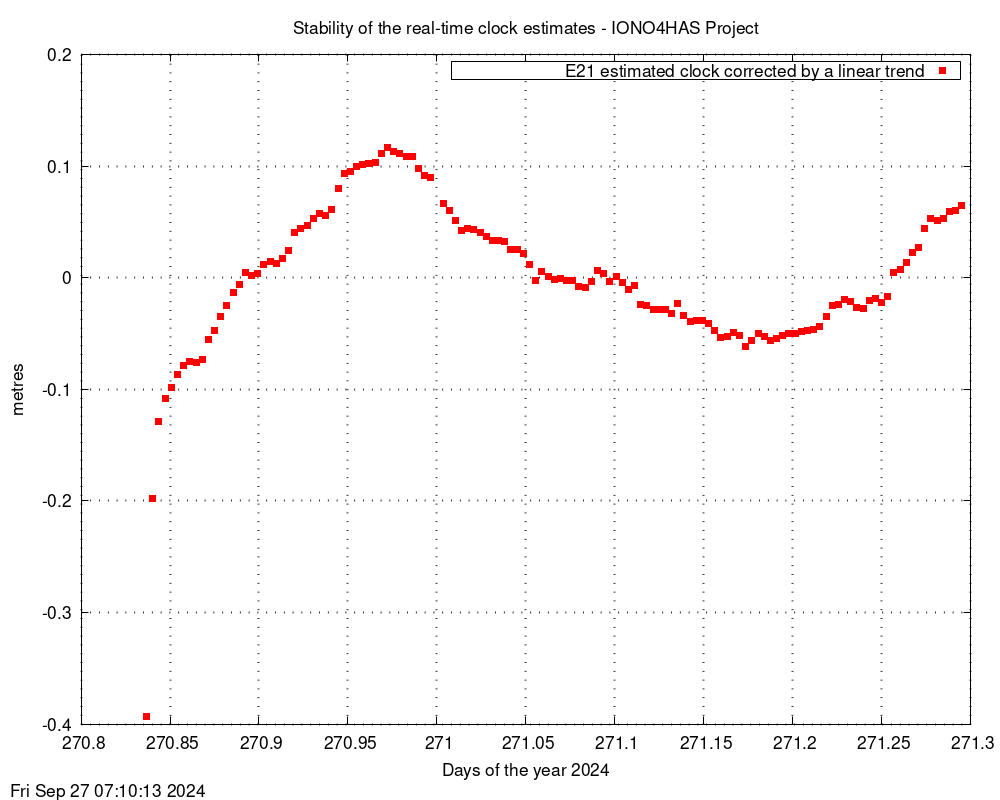
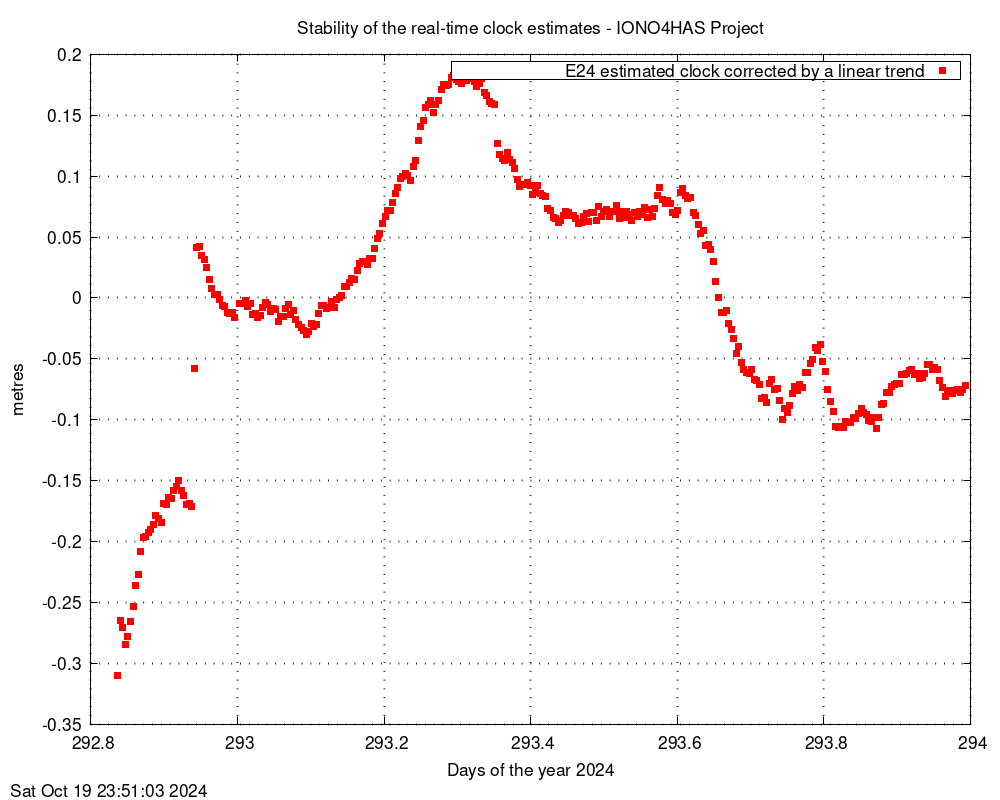
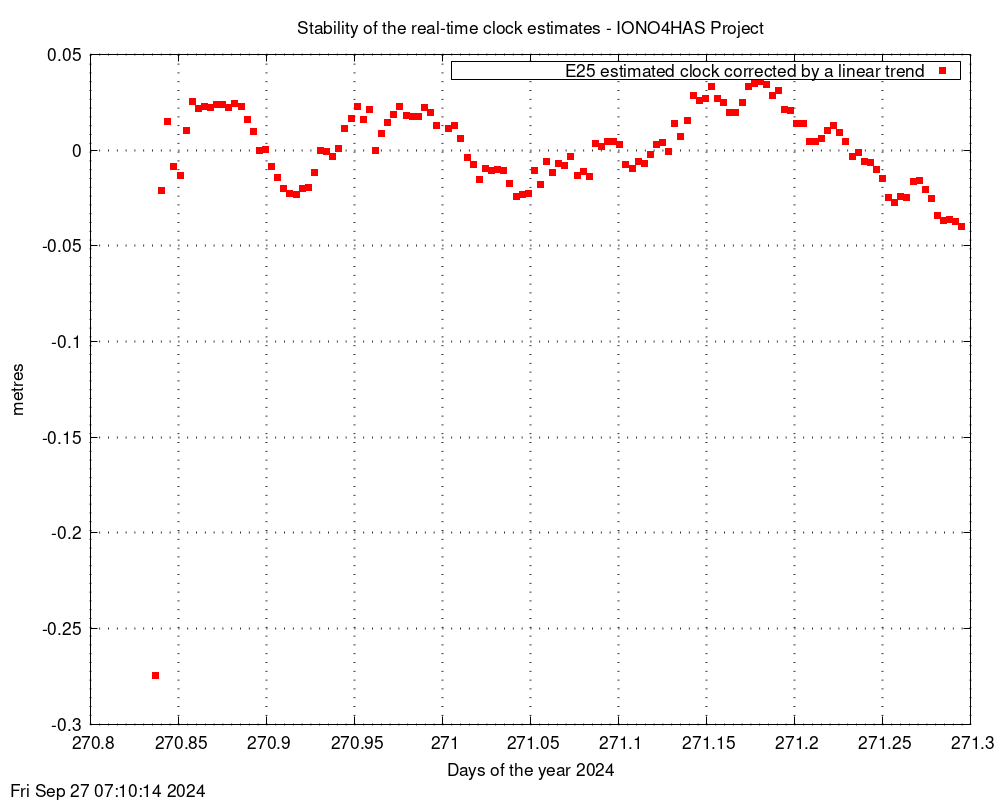
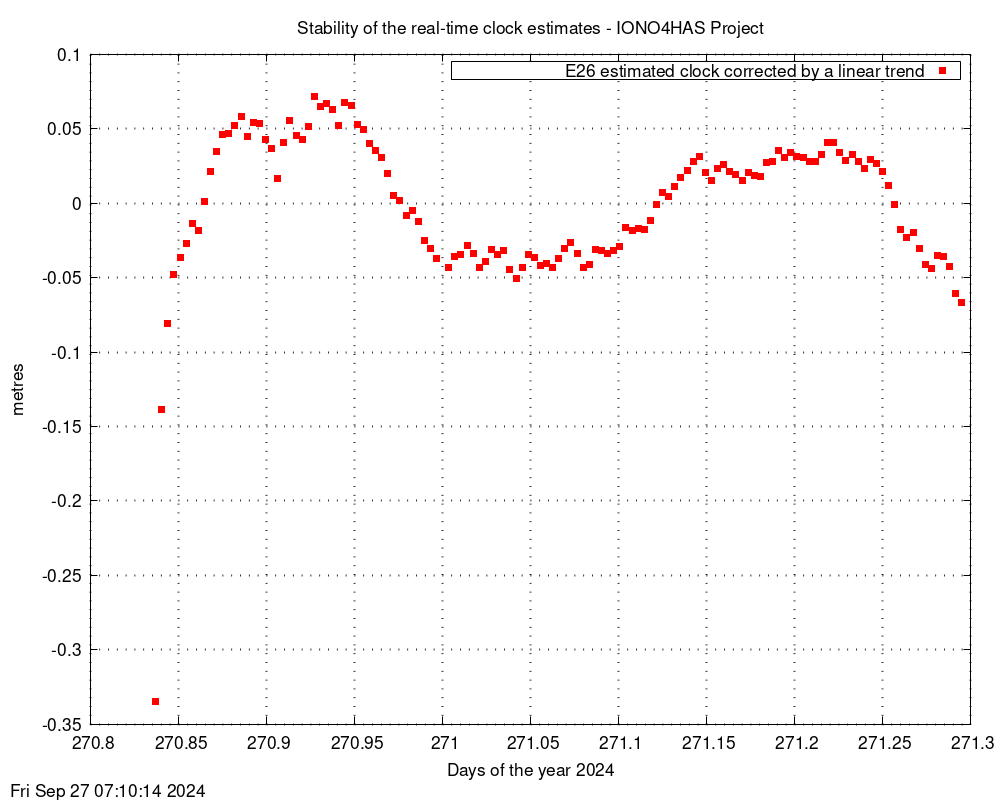
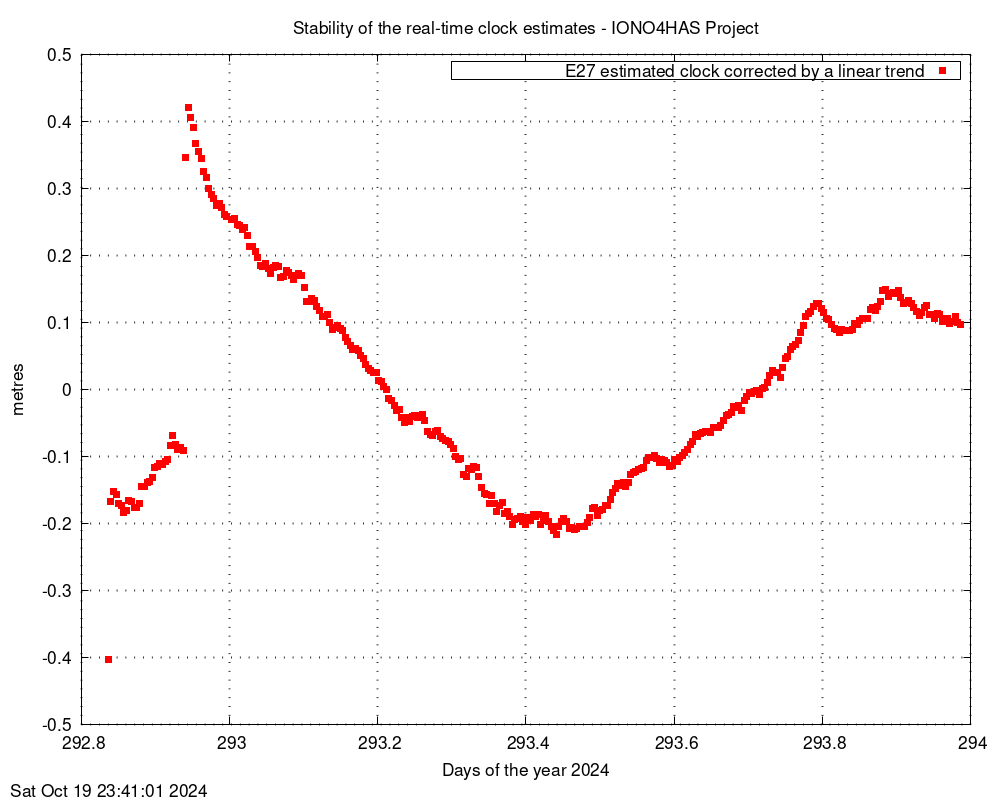
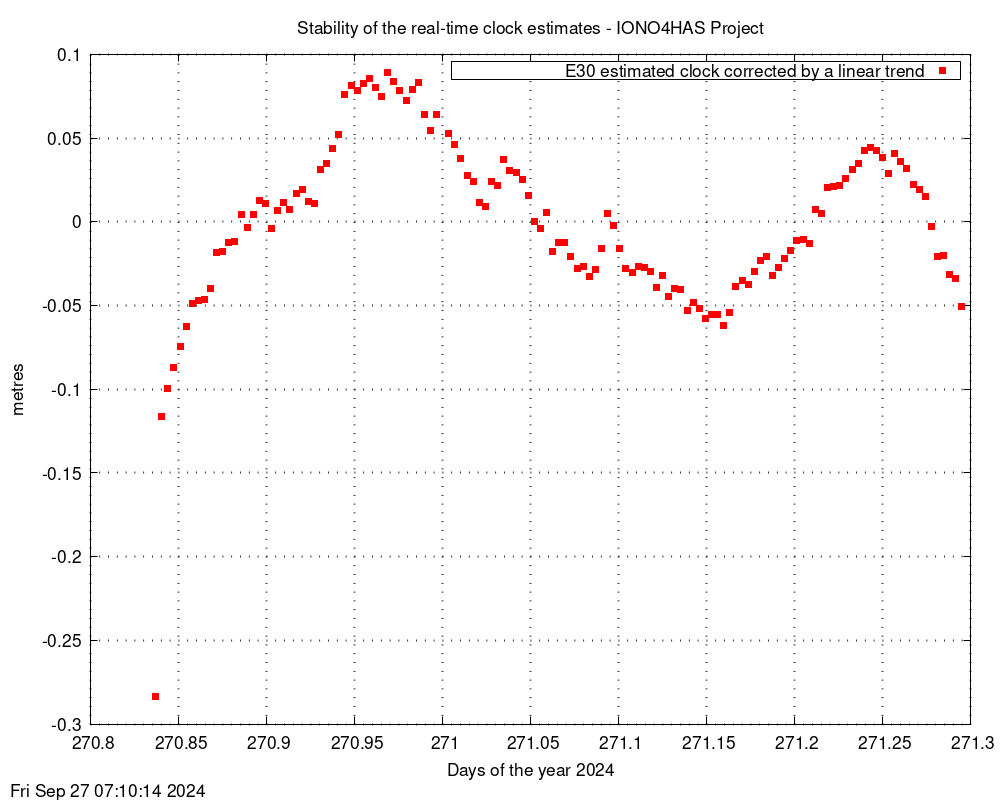
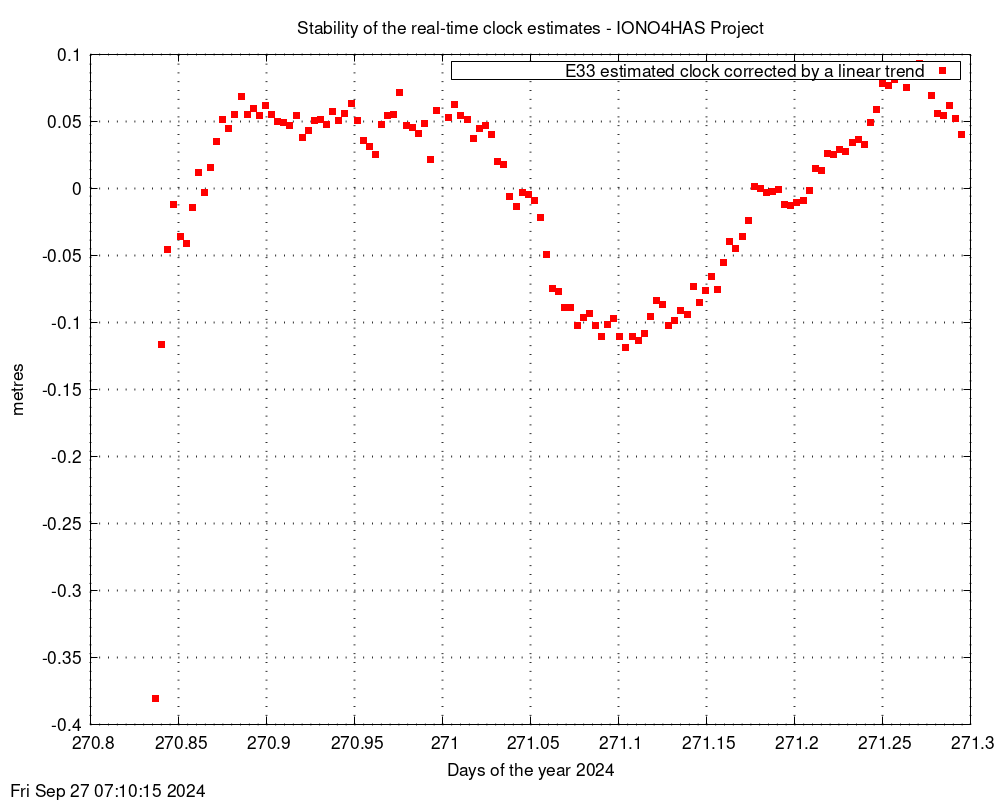
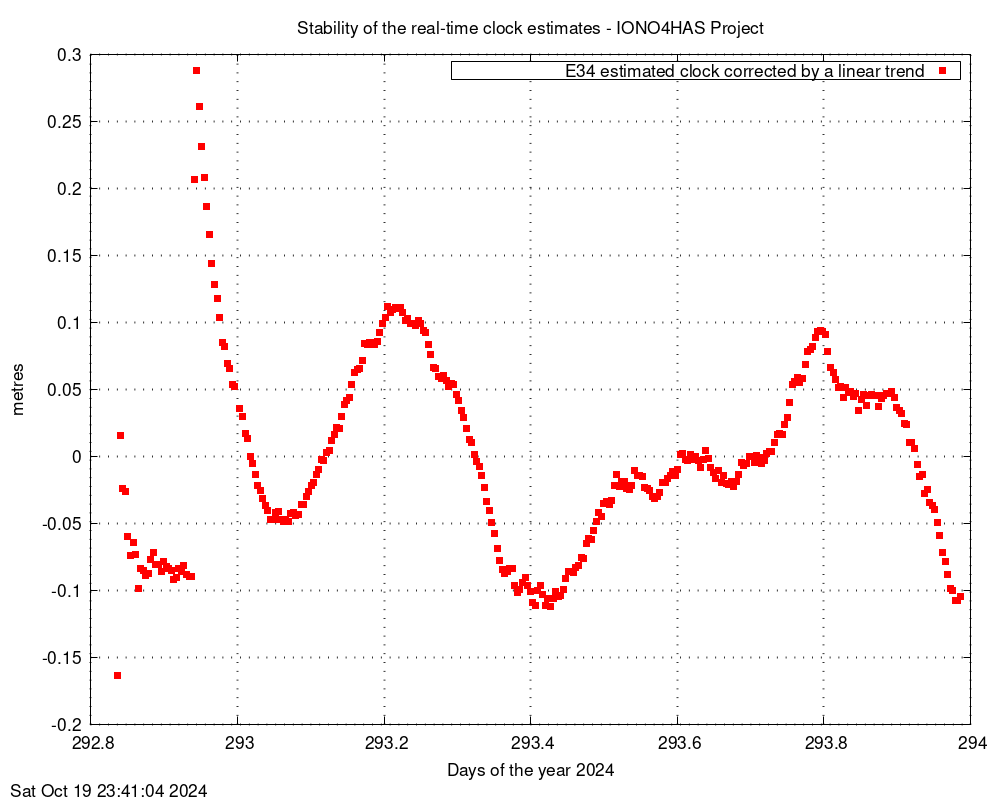
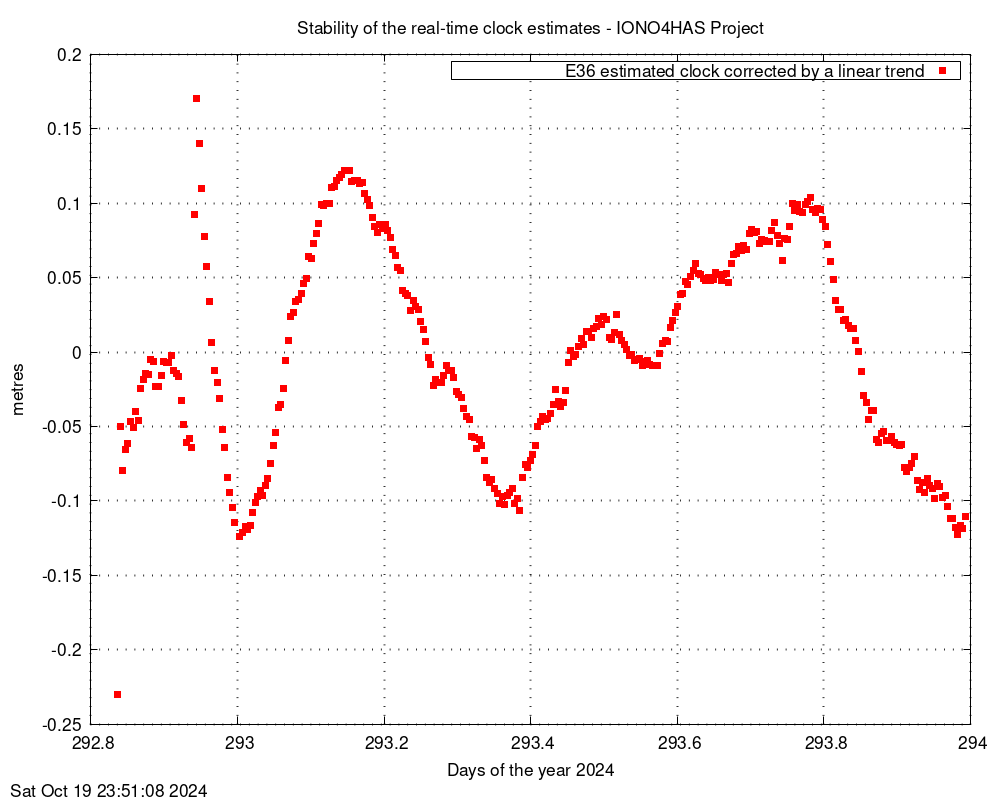
Satellite clock monitoring
Real-time estimates of the satellites clocks. This computation applies a filter to remove the linear trend and better characterize each clock stability. Cells in red are for non-operative satellites.
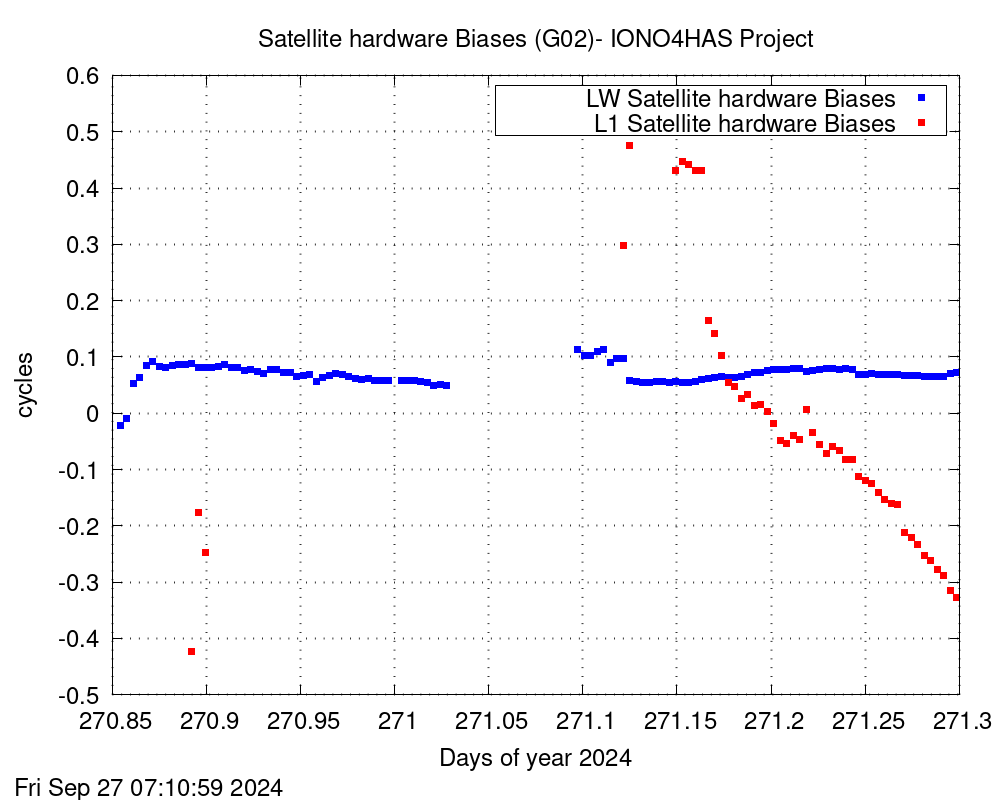
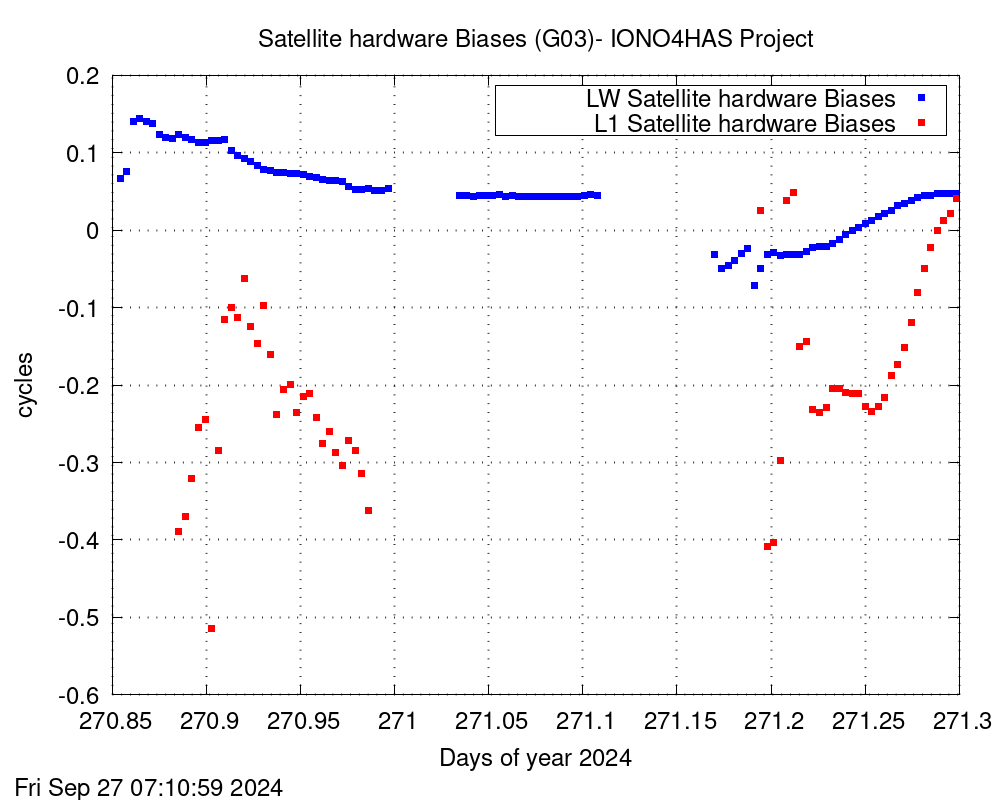
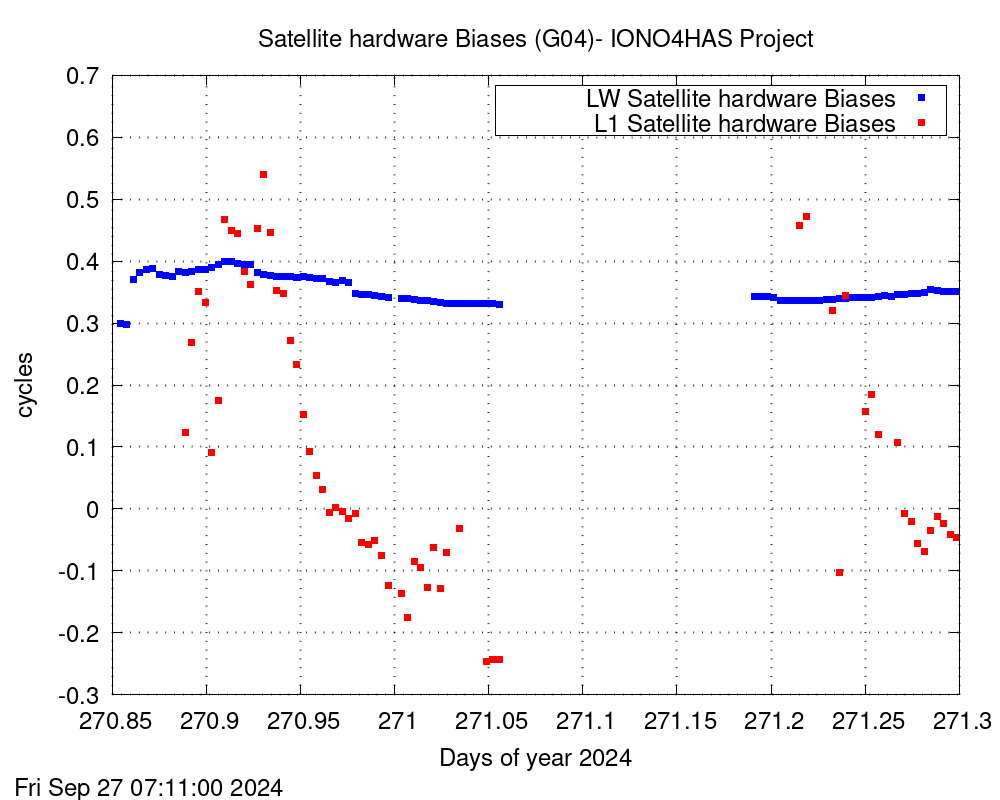
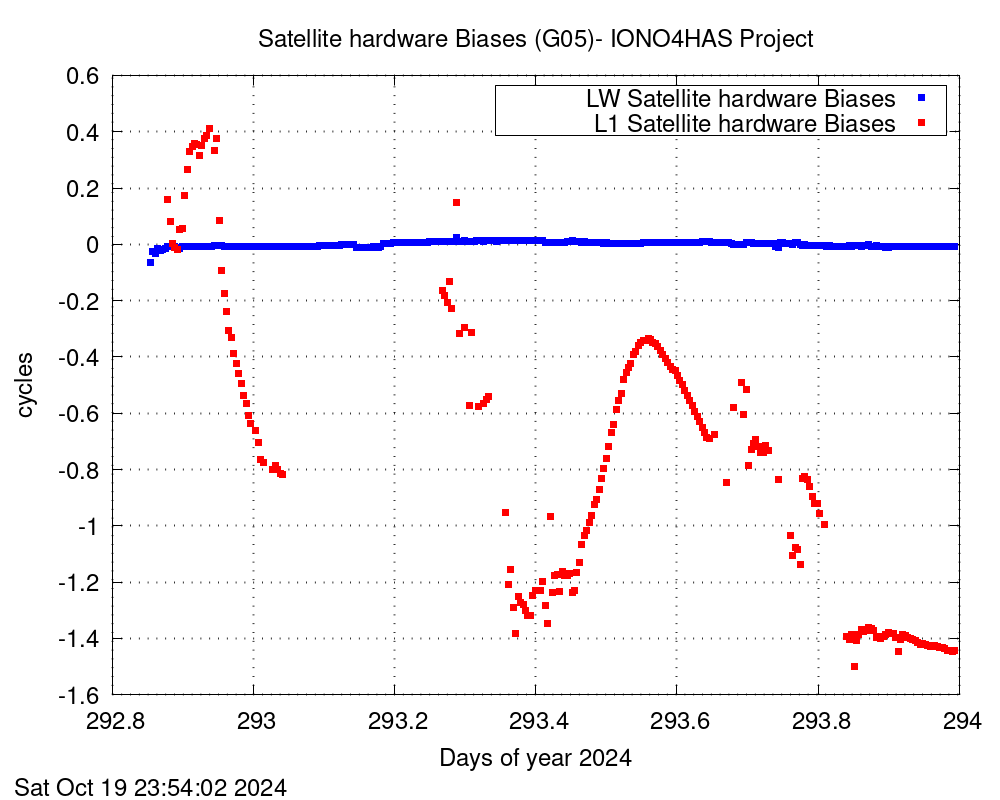
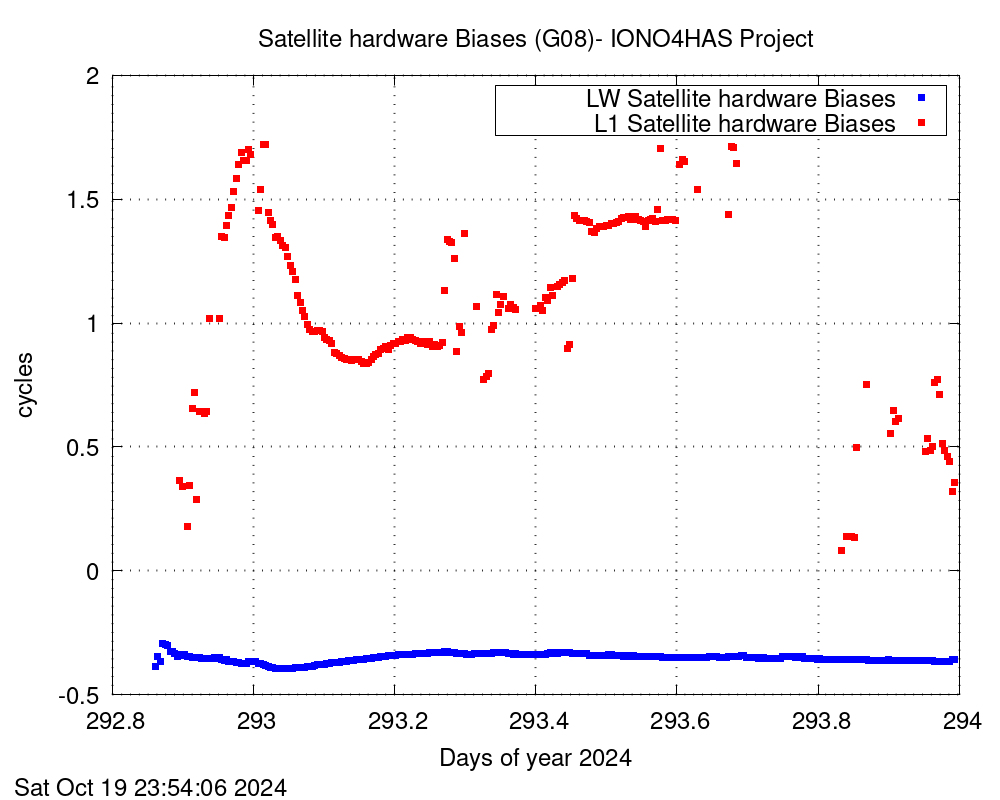
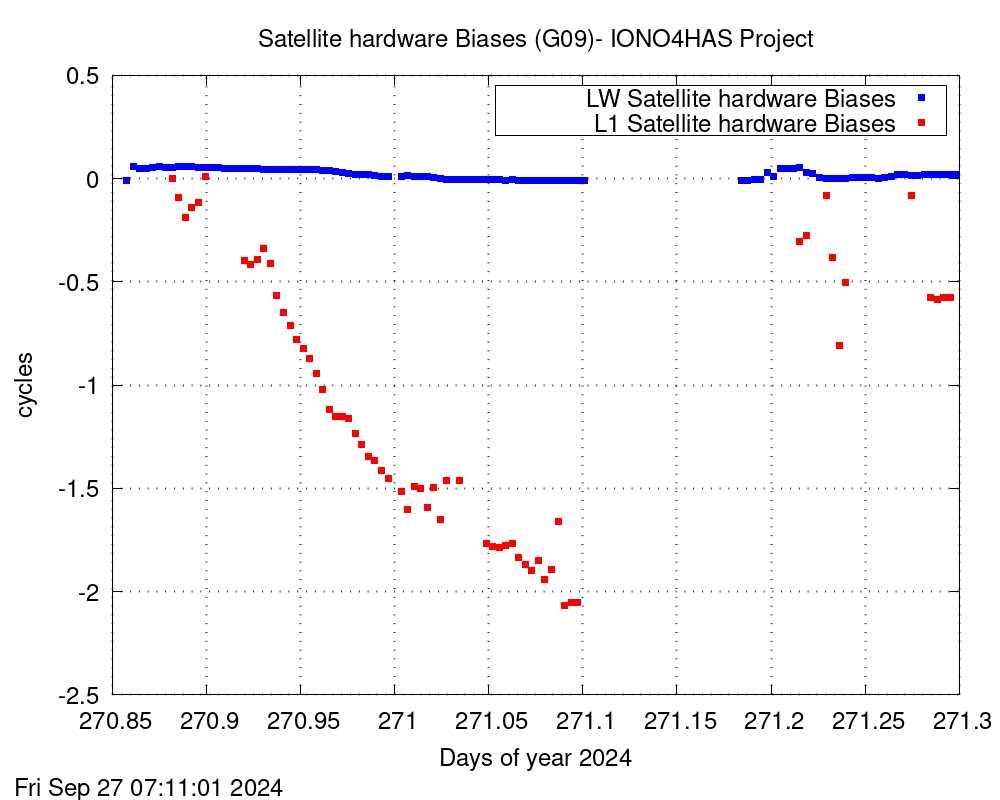
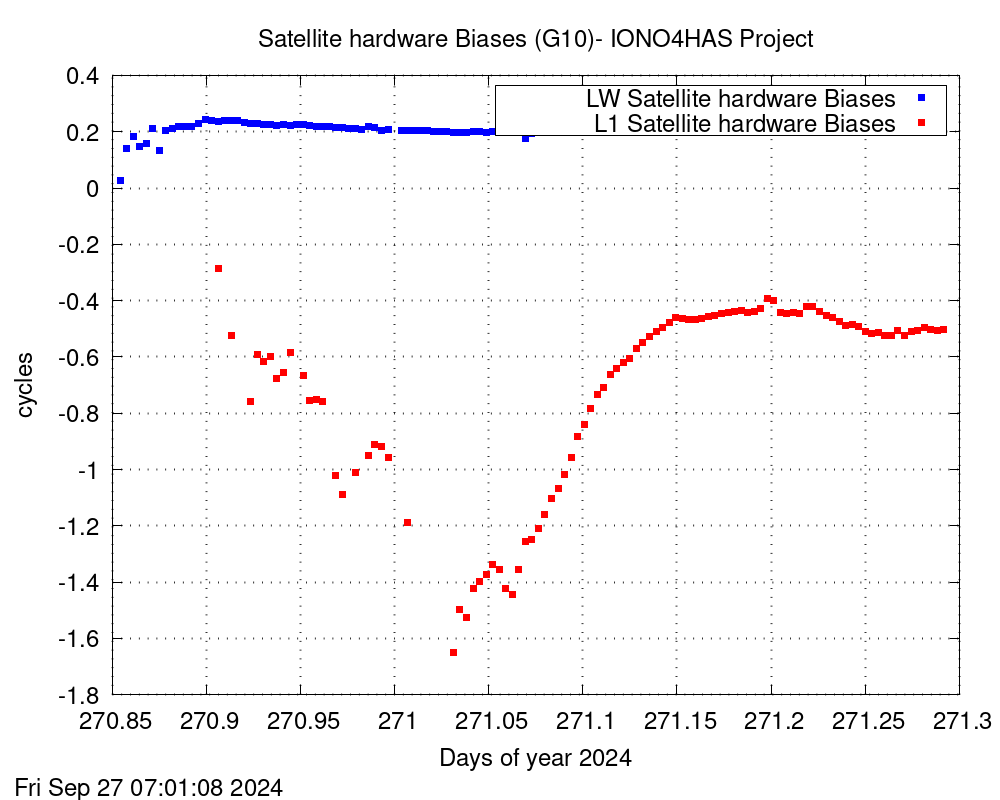
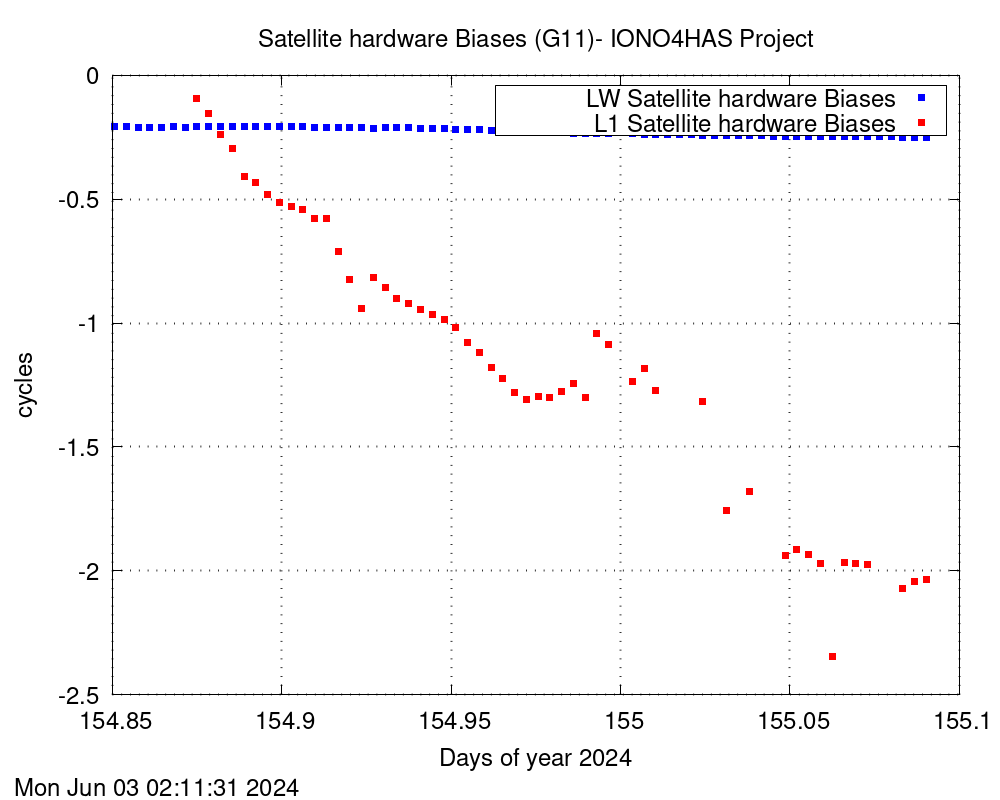
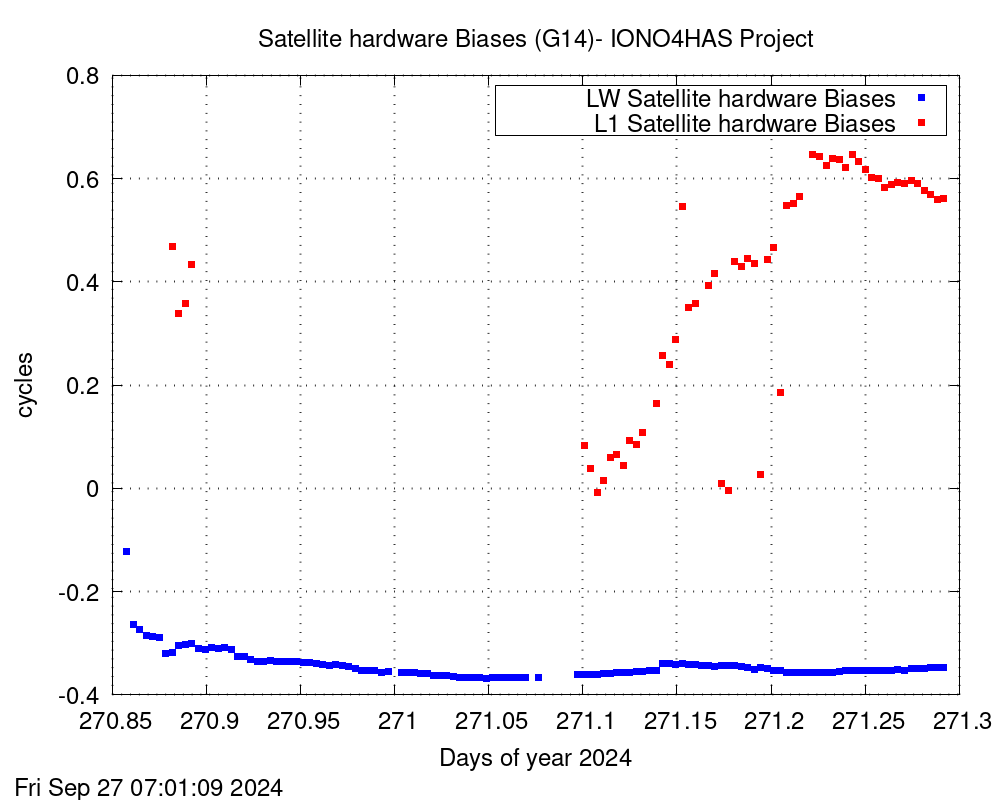
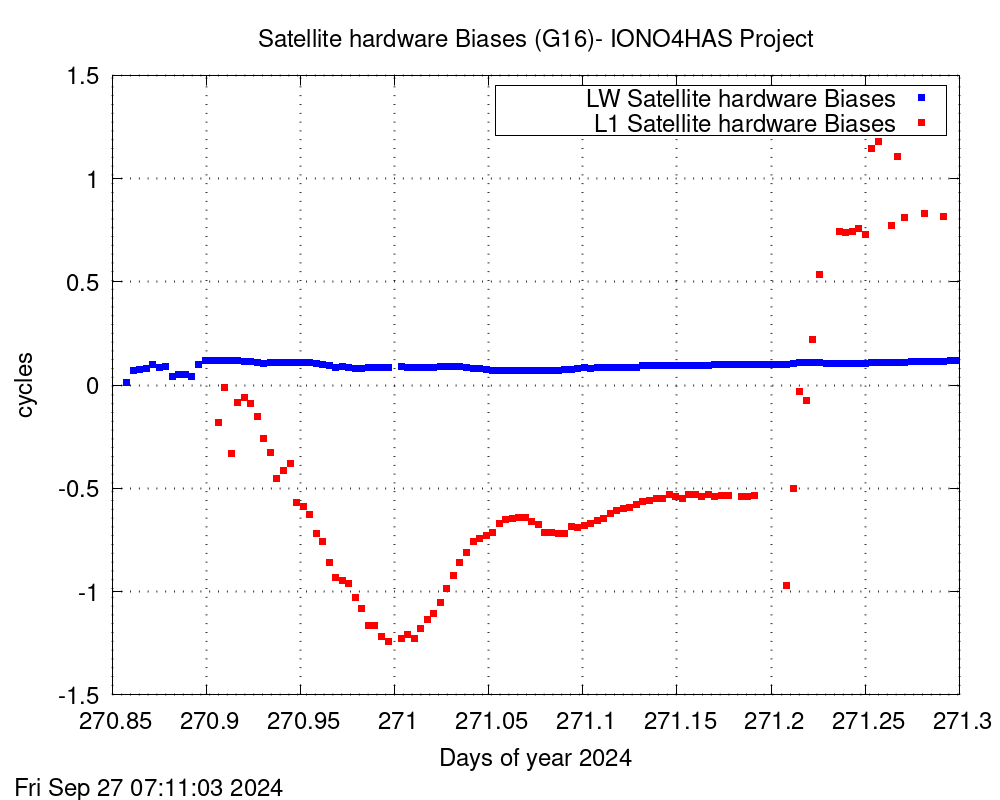
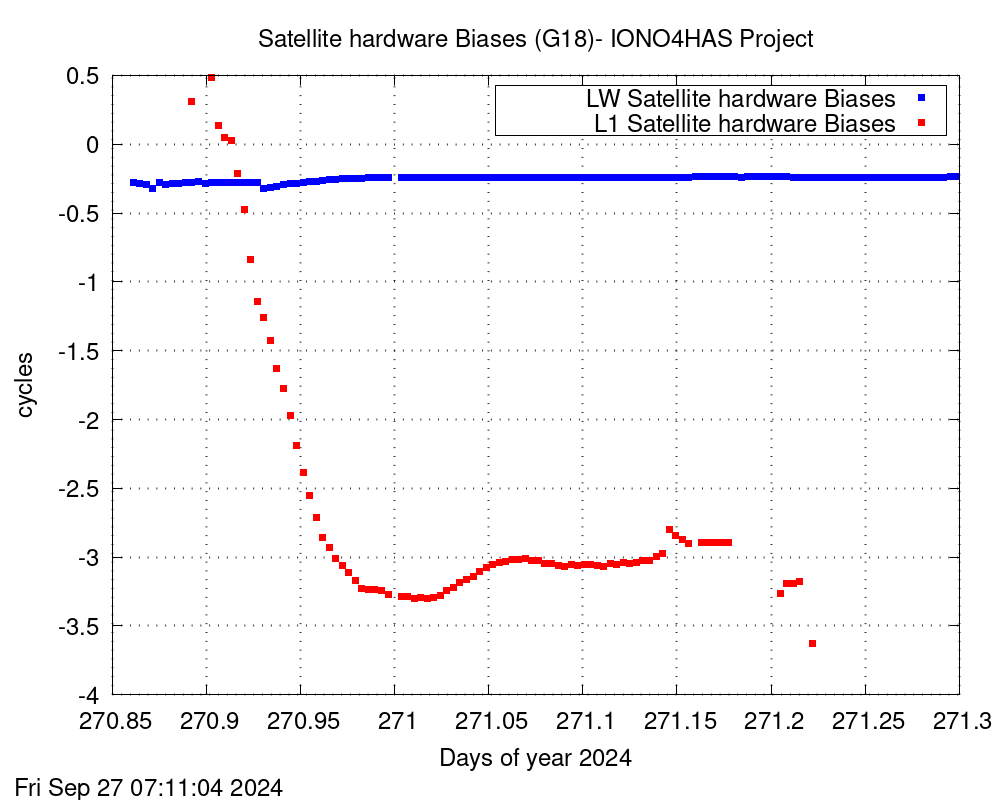
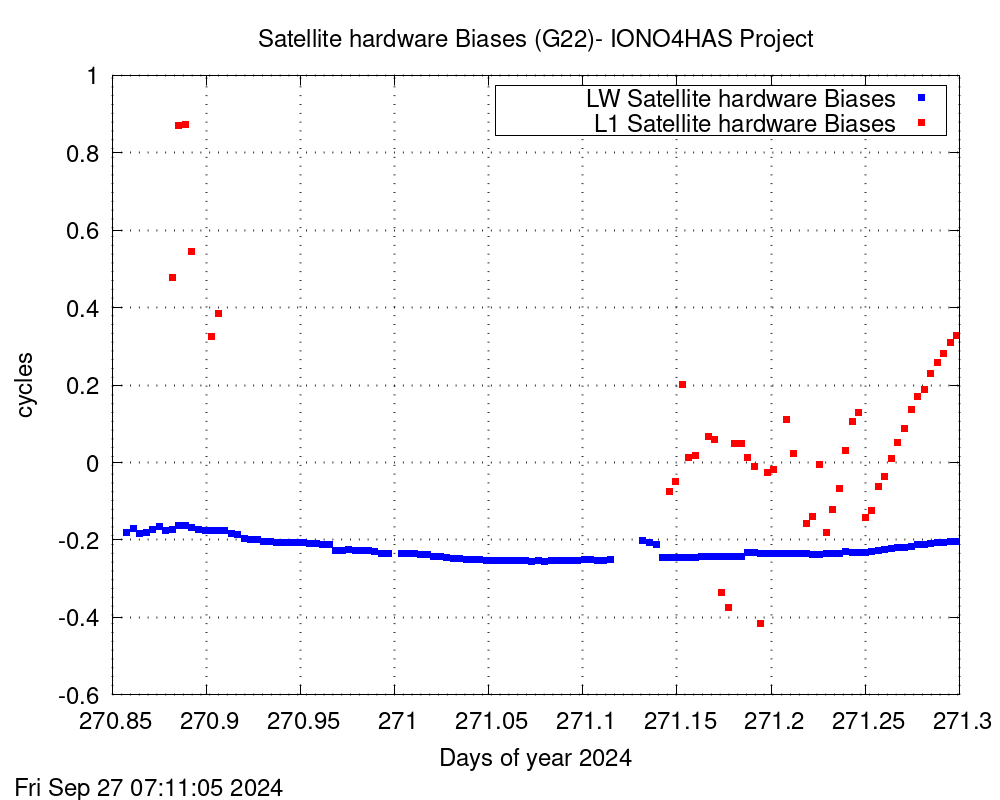
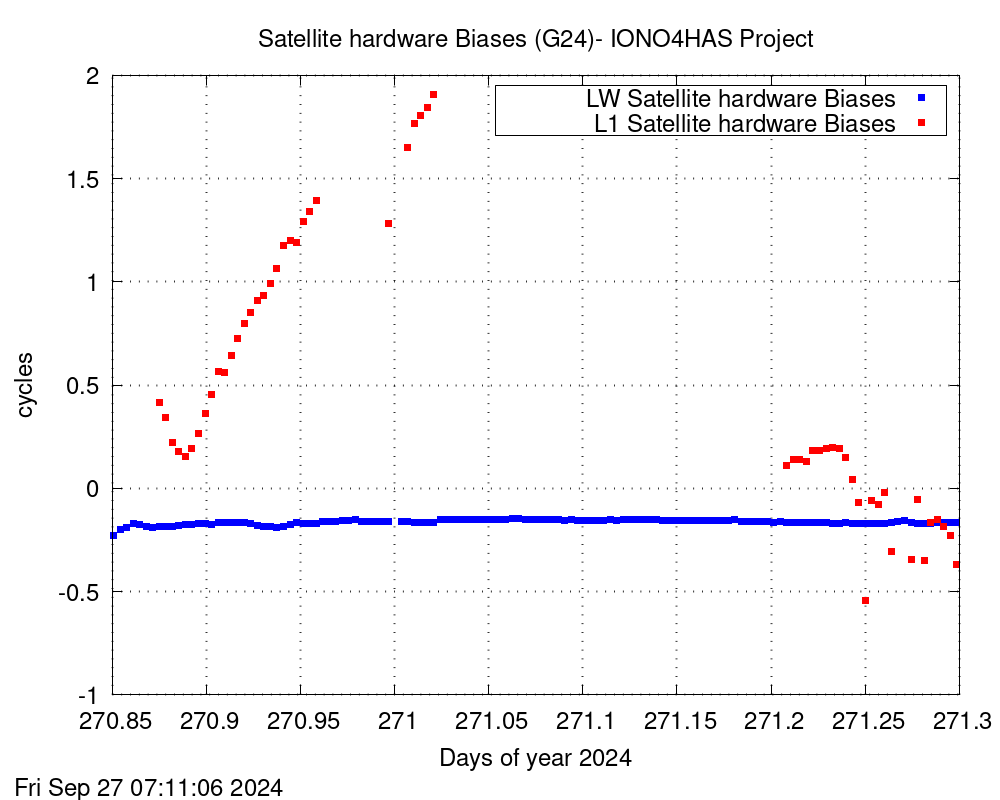
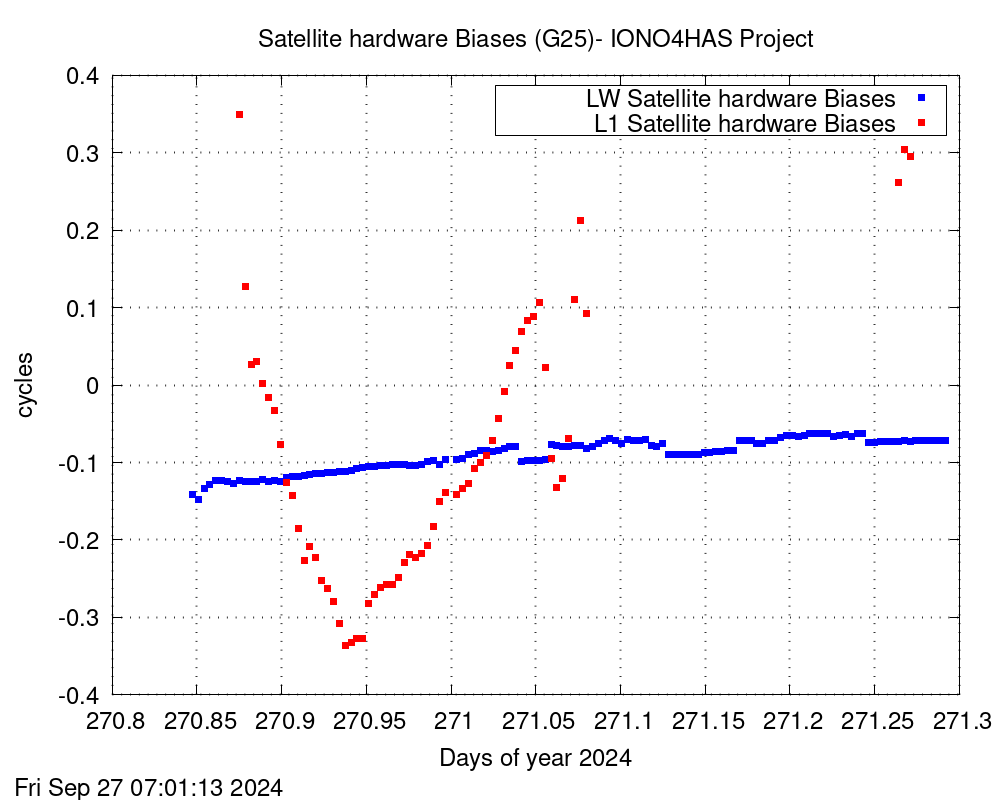
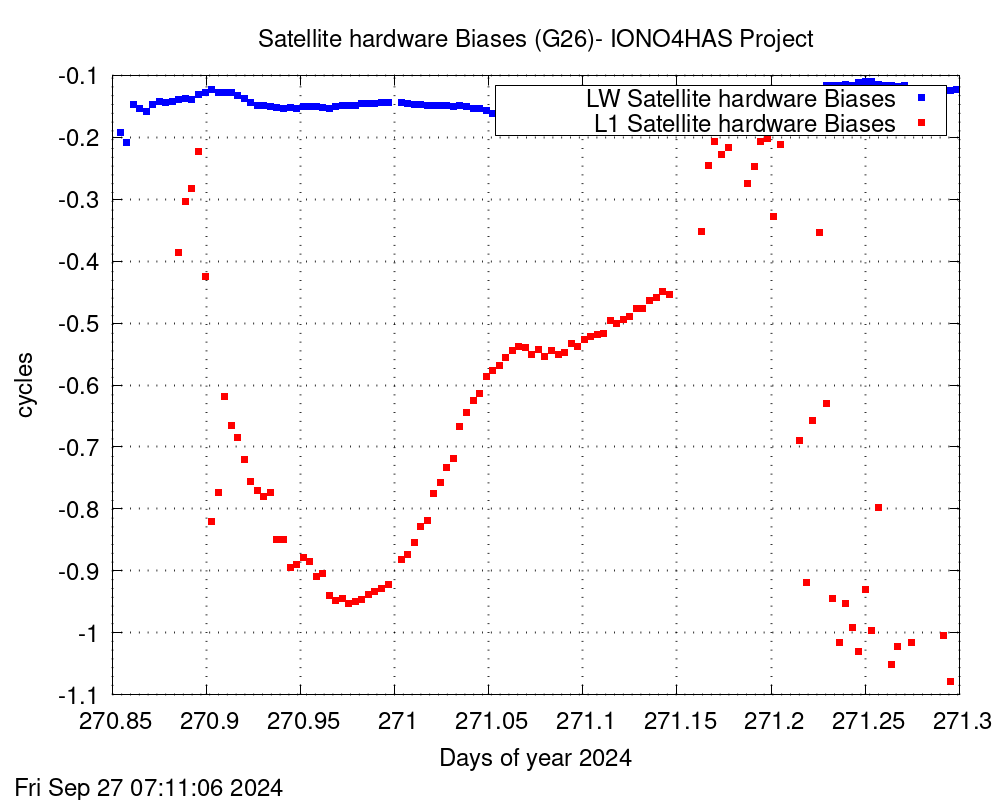
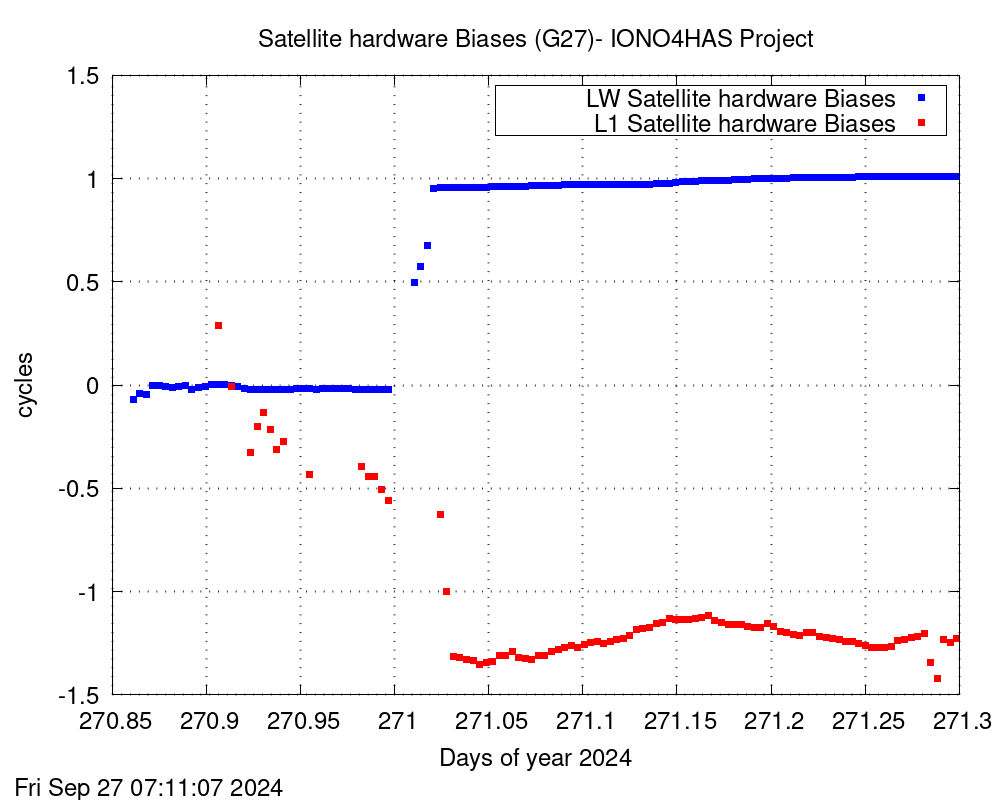
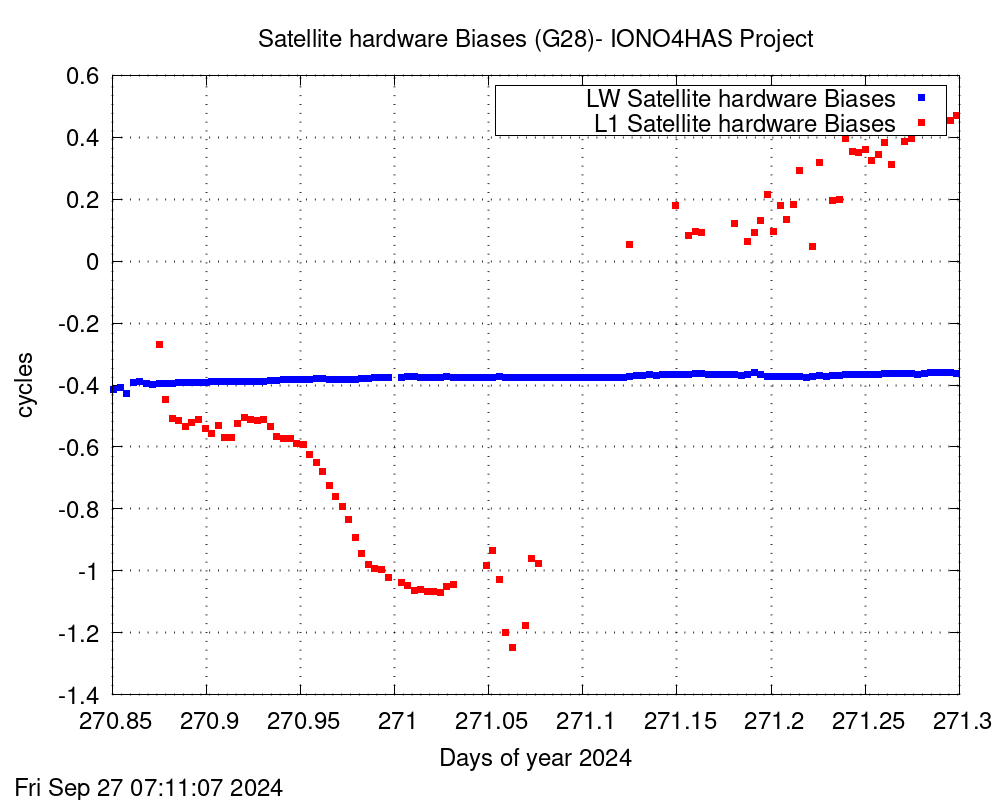
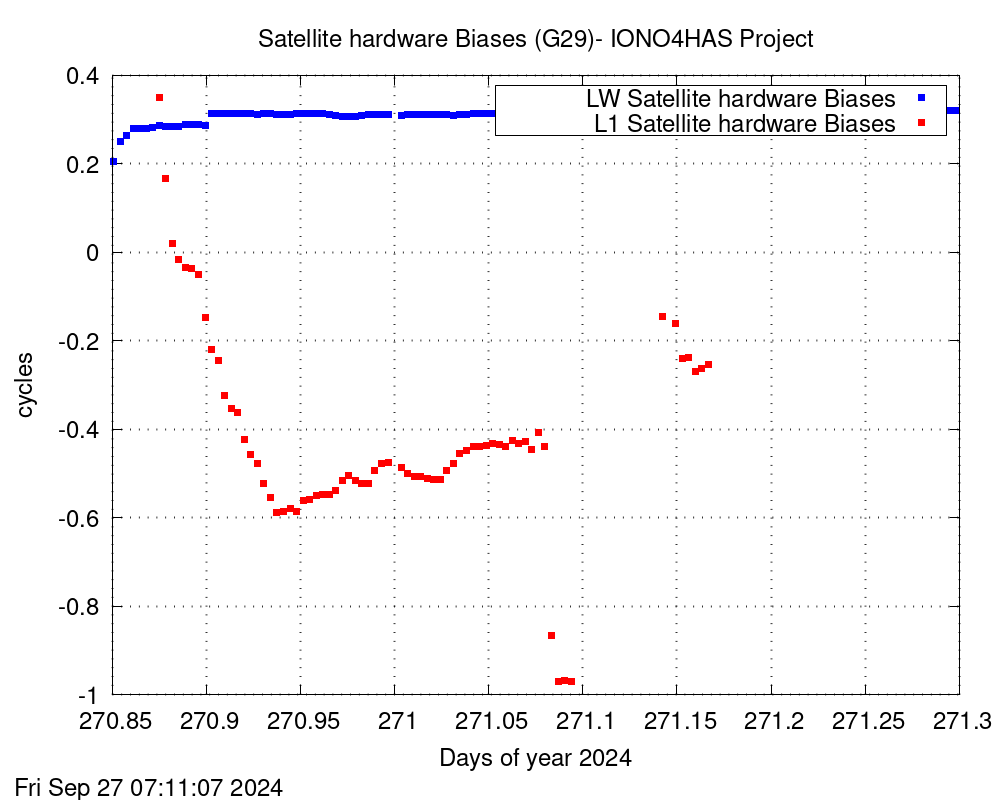
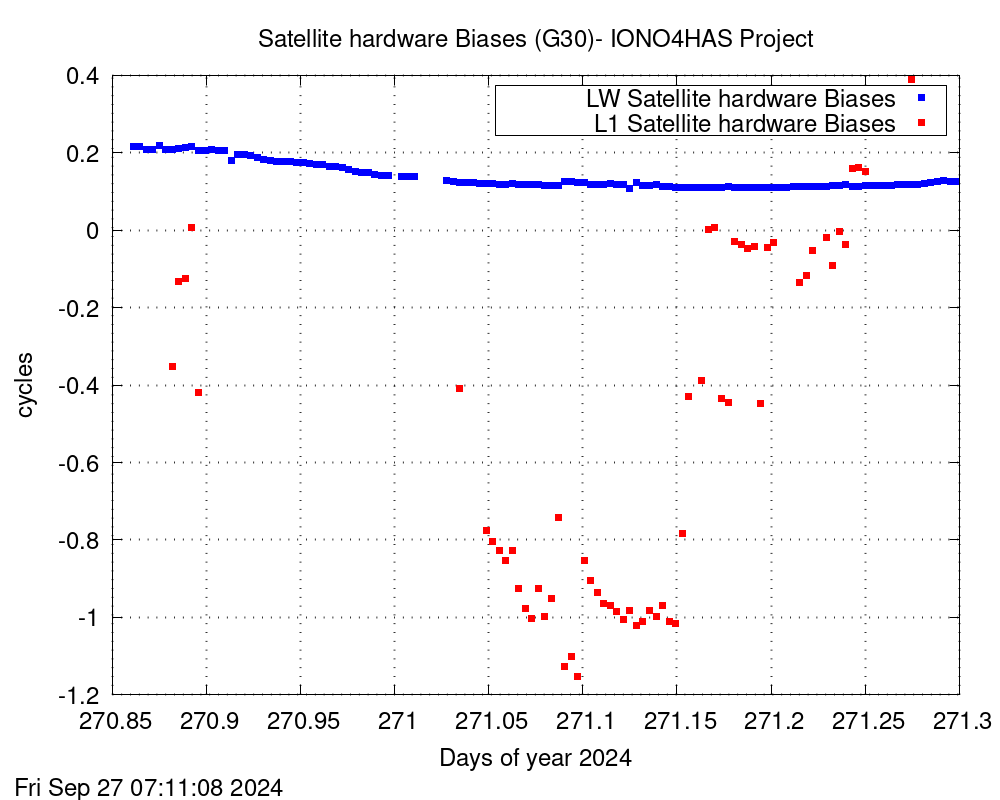
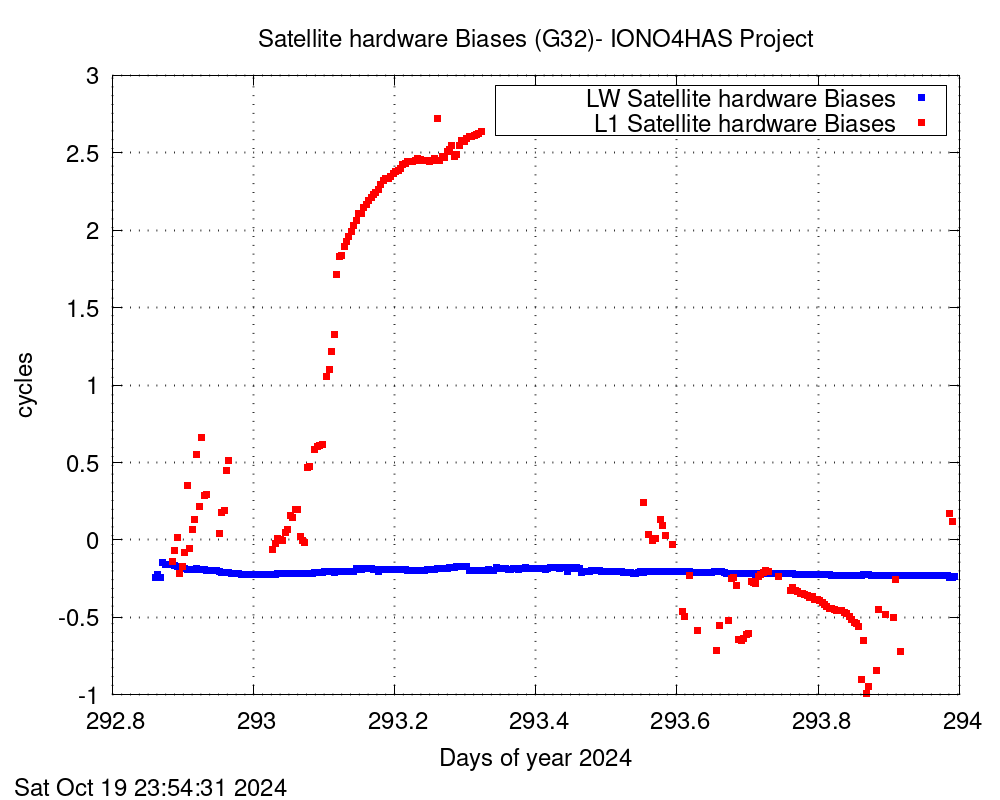
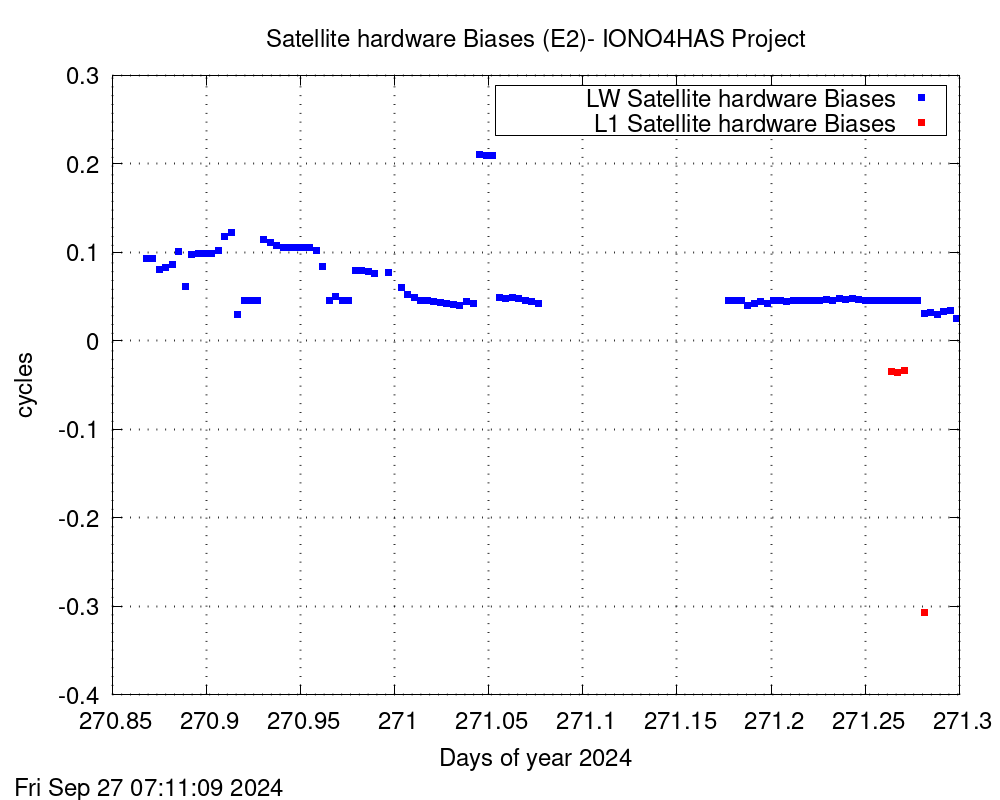
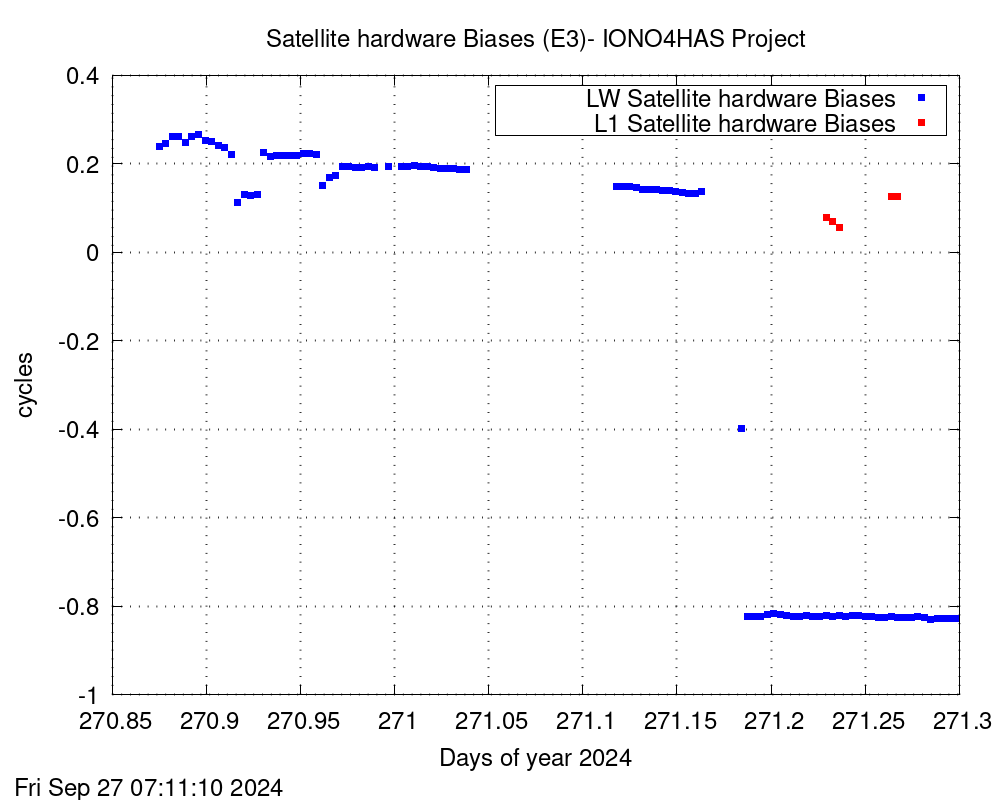
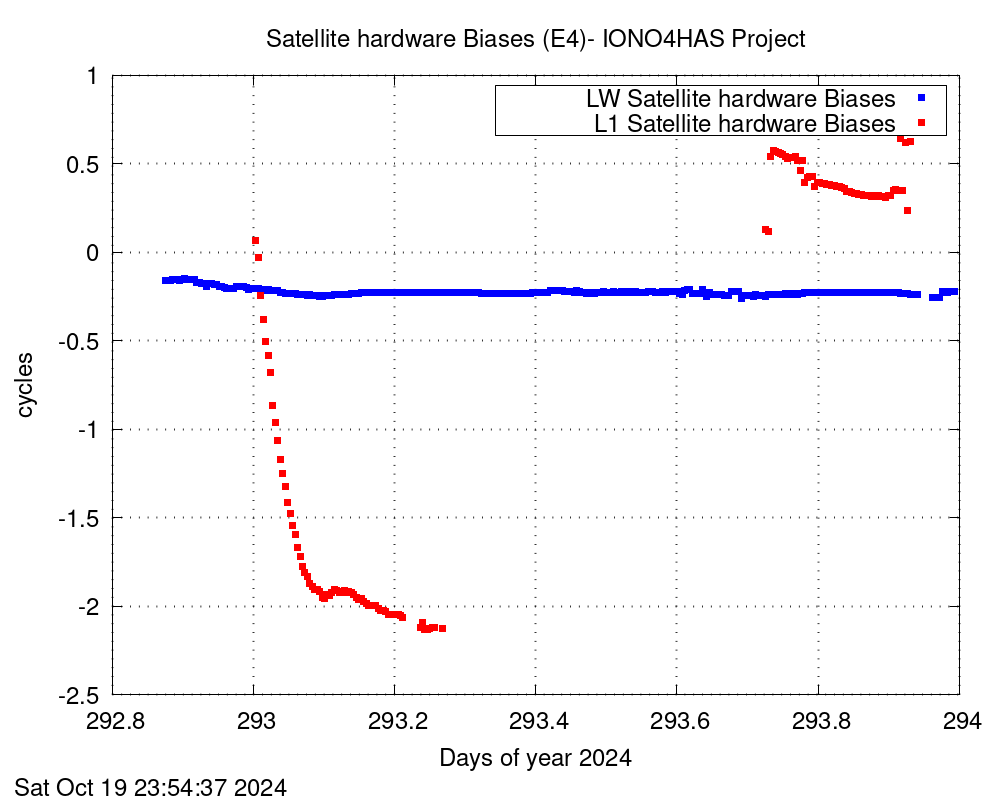
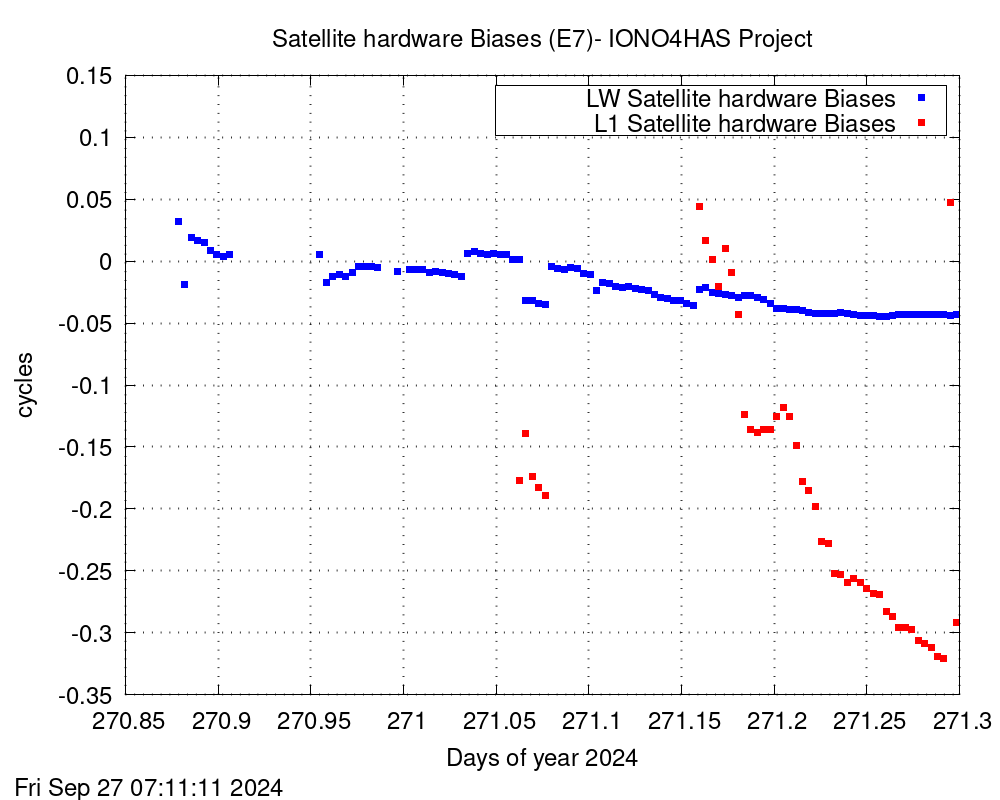
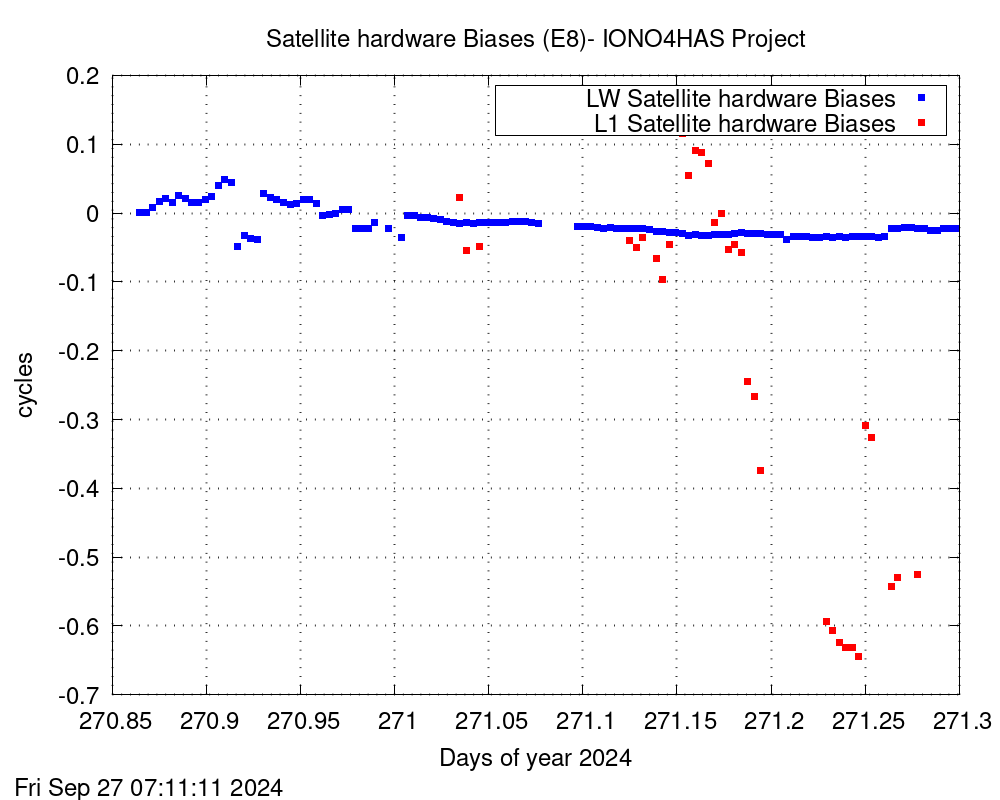
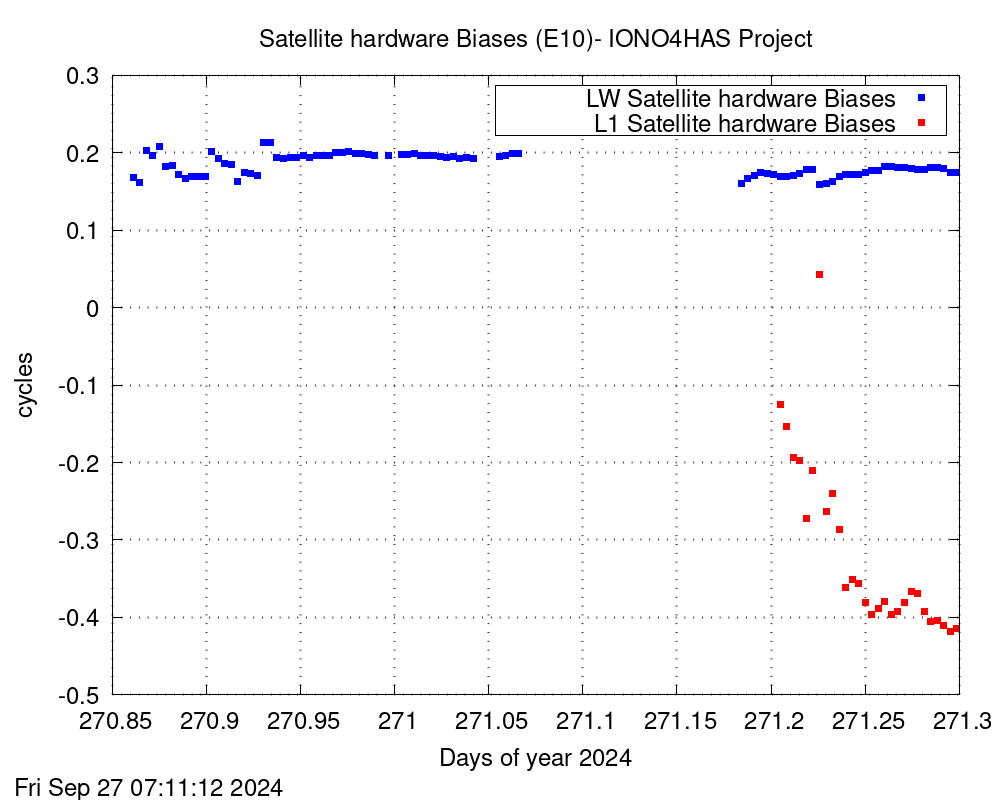
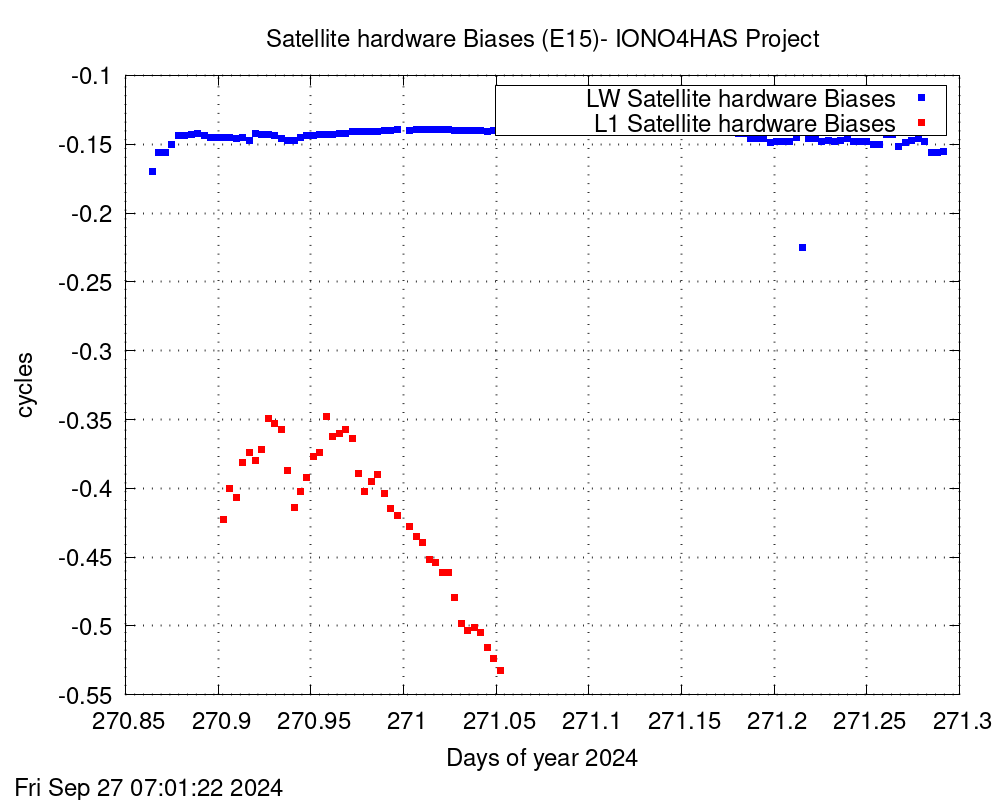
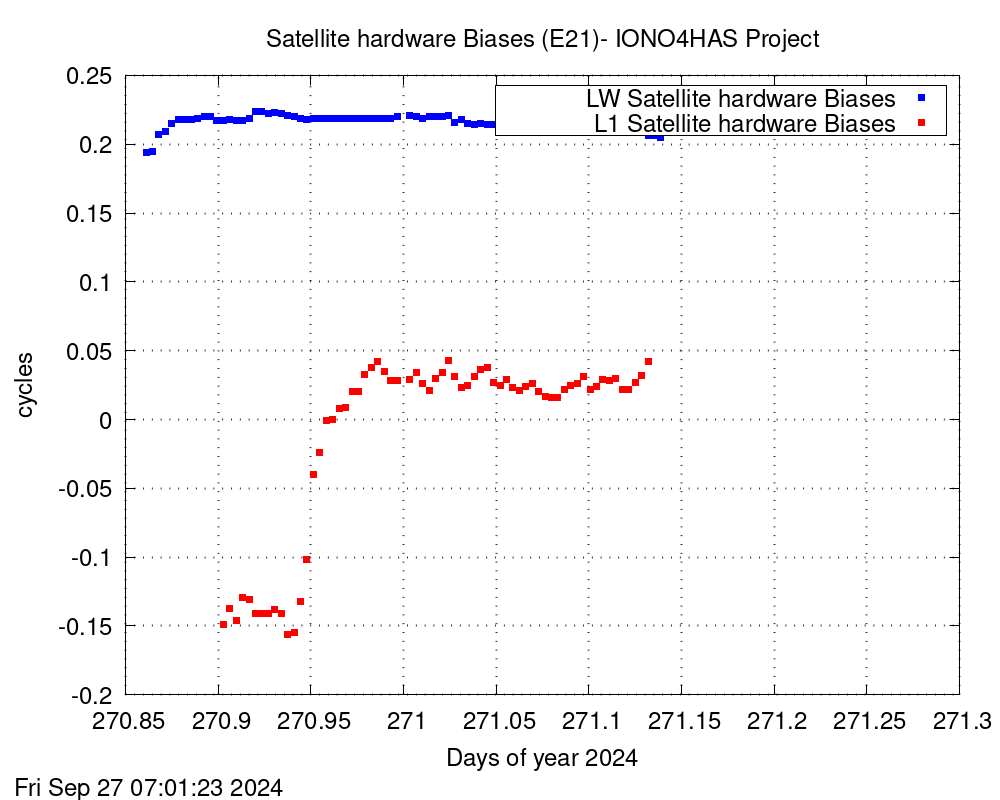
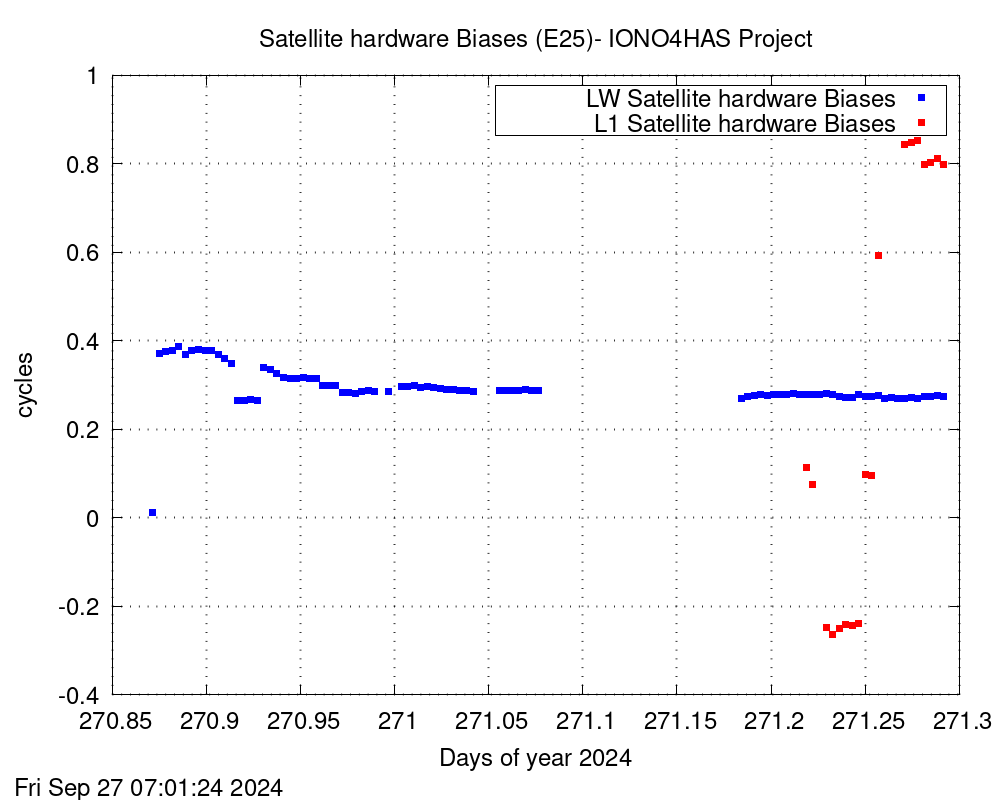
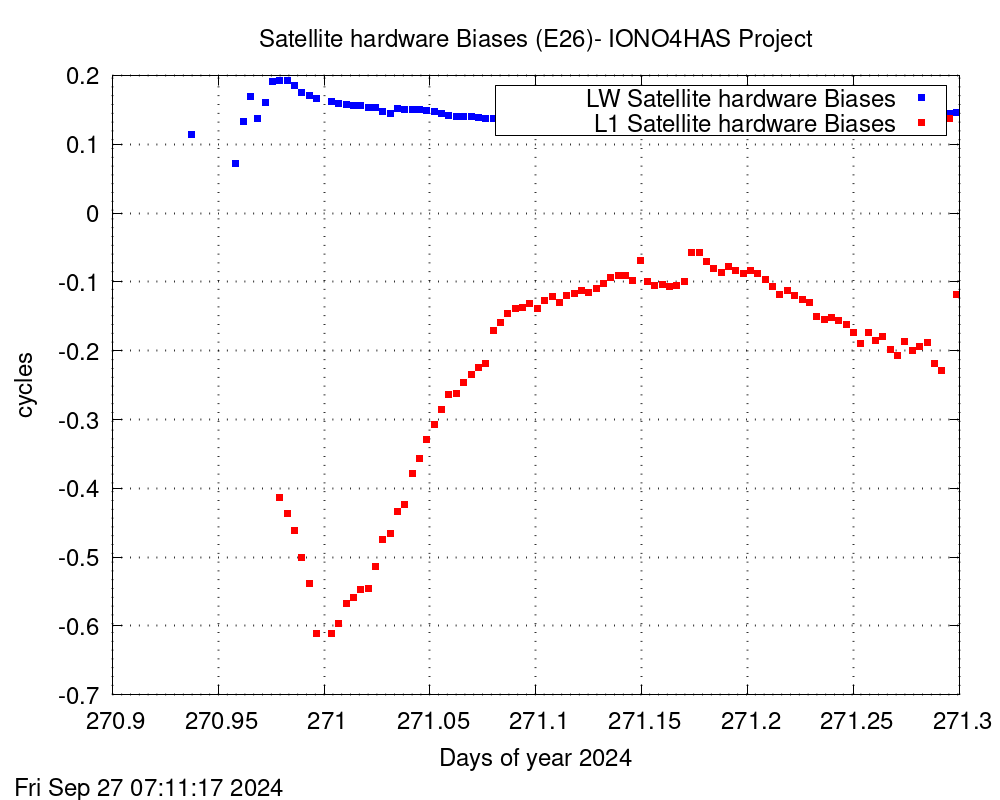
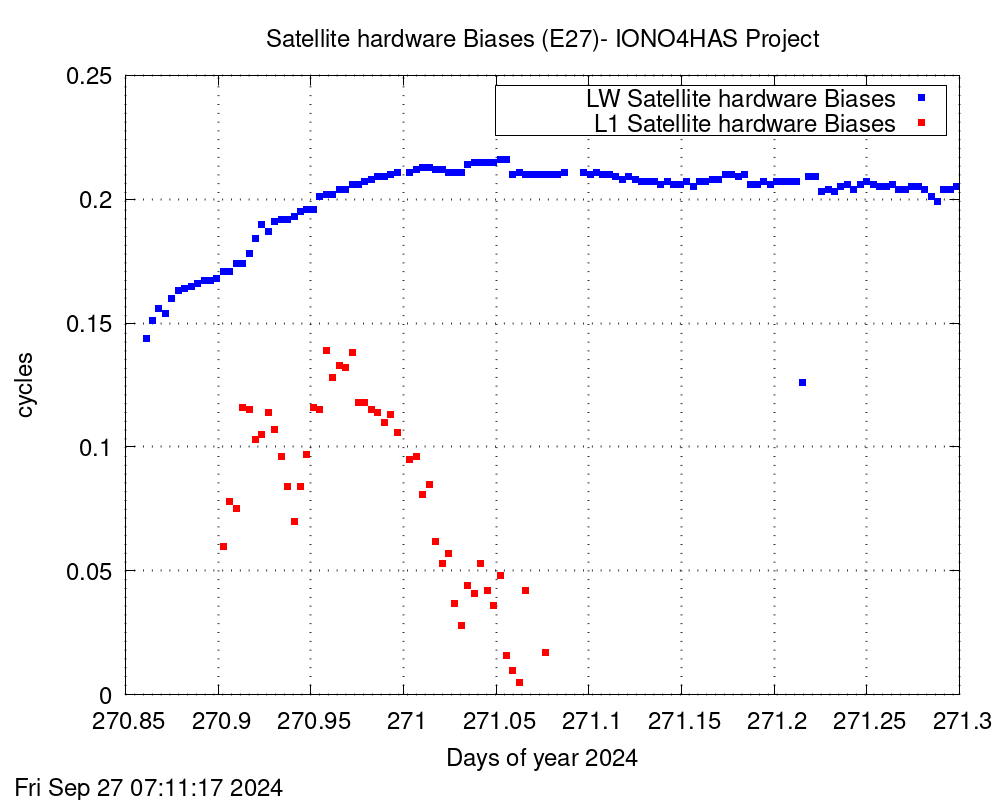
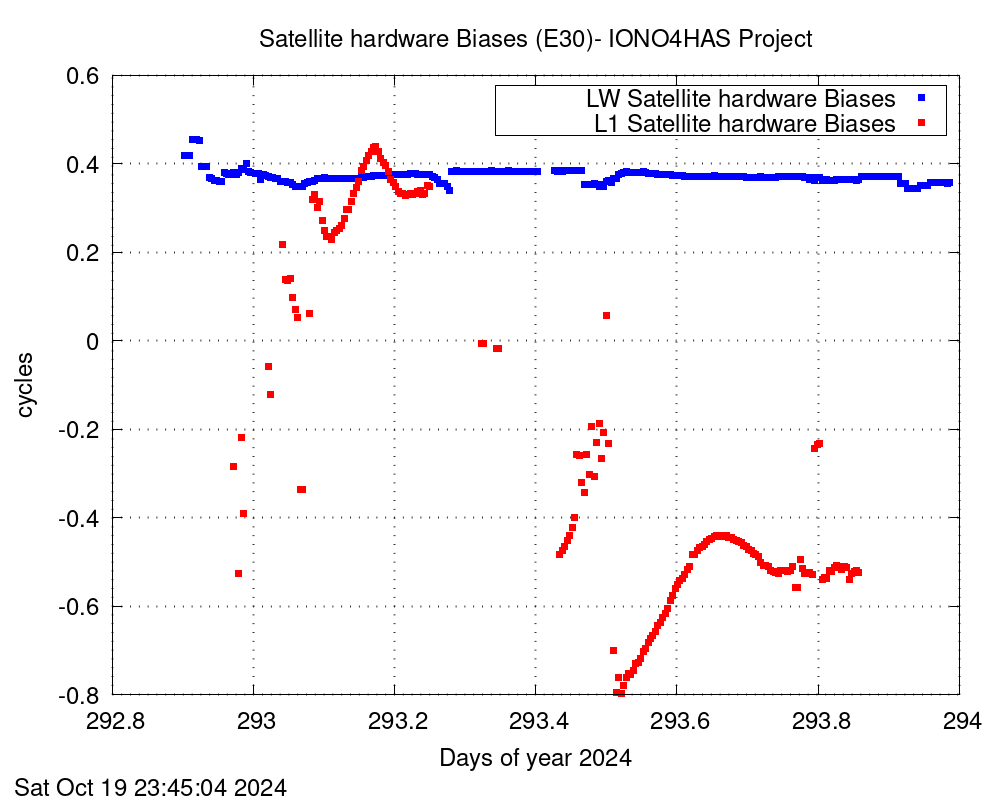
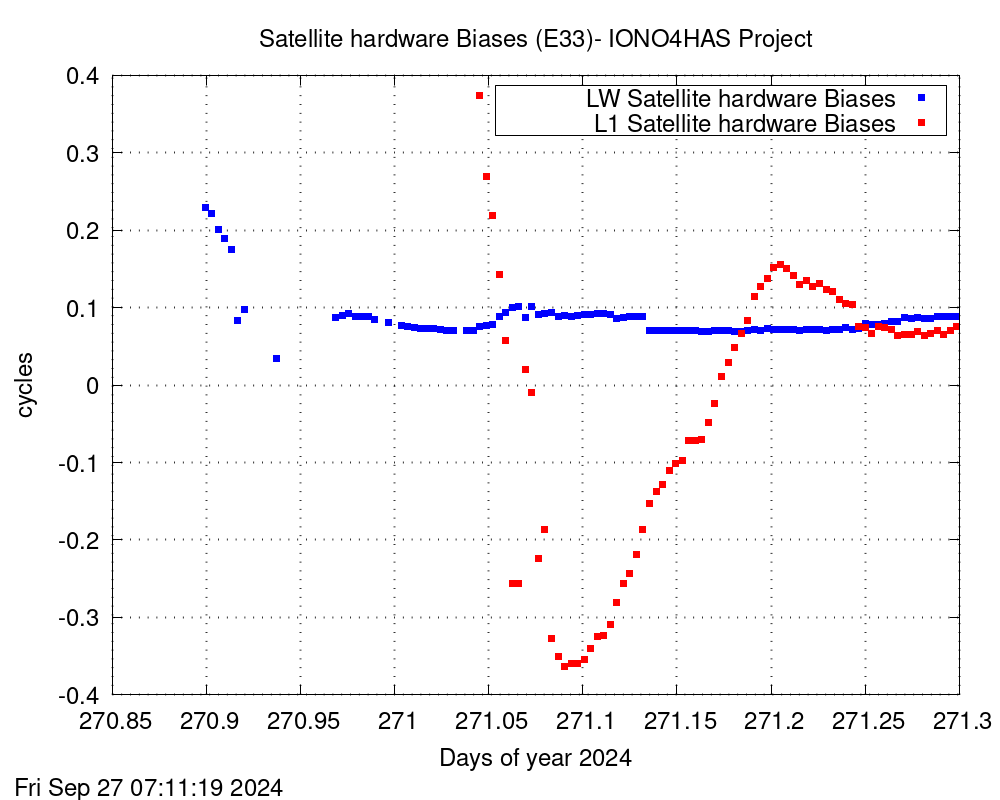
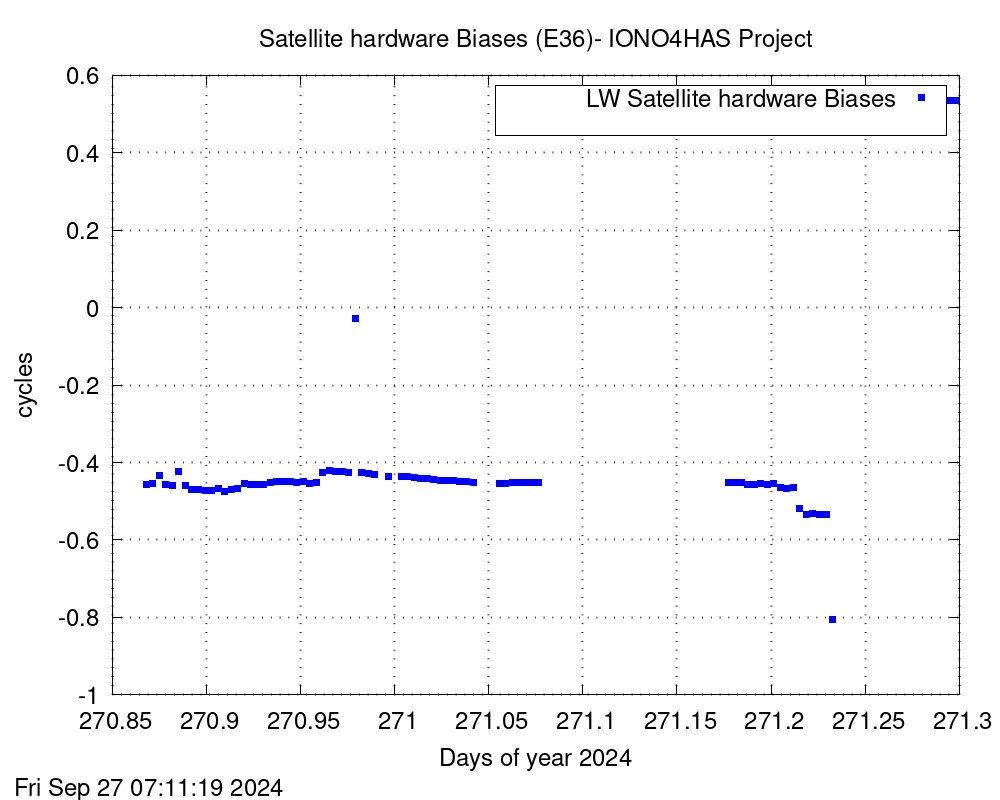
Satellite phase-biases monitoring
L1 and LW phase biases computed for each one of the satellites to allow any receiver to fix its ambiguities. Cells in red are for non-operative satellites.
Station clock and troposphere monitoring
The real-time estimates of the stations clocks applies a filter to remove the linear model to better characterize each clock stability. Real-time estimates of Zenital Tropospheric Delay (ZTD) for each station are computed according (see "5.4.2 Tropospheric Delay")
Scroll down and select a station name to depict:
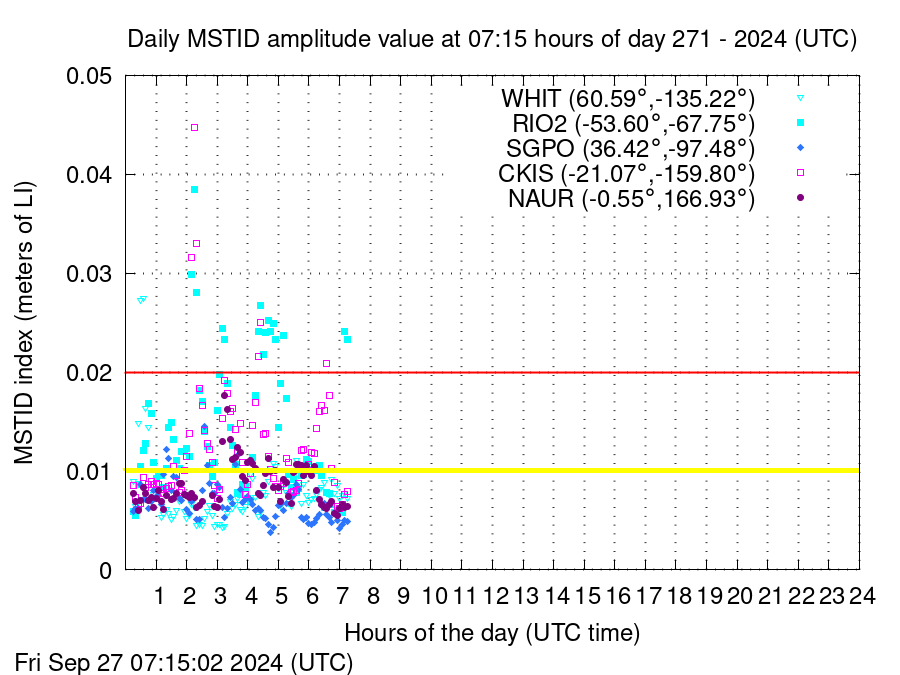
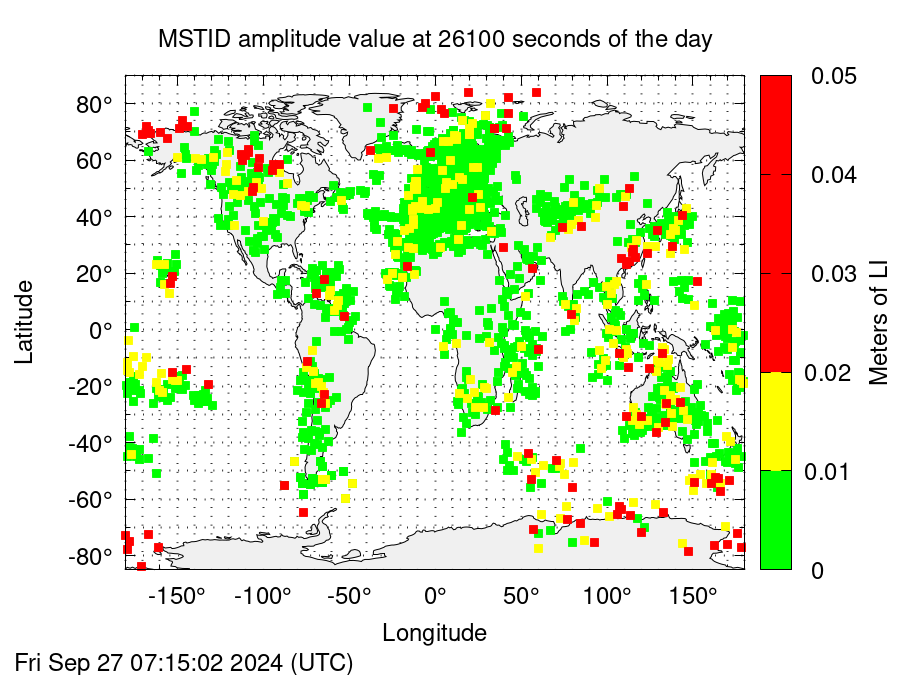
The AATR and MSTID indexes: monitoring local and regional the ionosphere
The implementation of the Along Arc TEC Ratio (AATR) and Medium Scale Traveling Ionospheric Disturbances (MSTID) detector indexes is intended to serve as complementary tools to dynamically adapt the process noise variables implemented in the IONO4HAS model to the actual ionospheric activity. The daily-cumulative plots five stations are chosen randomly (in accordance with high, medium, low and ewuatorial latitudes) from the whole set of IONO4HAS working stations.
Worldwide plots represents areas in which is possible ot obtain the indexes, using the whole network of IONO4HAS working stations. The green-yellow-red colour code is used to denote a weak, medium or strong ionosphere activity. The 24-hour image animation of the two-layers ionospheric modelling is presented next for yesterday computed data.


Real-time ionospheric plots
Provided corrections and modelling of the ionosphere is given using a two layer model. The following animations are made up with images every 5 minutes (300 s), representing the first and second layer values and its corresponding sigma values.
First layer real-time ionospheric Modelling
Historical plot-database: First layer ionospheric Modelling
Second layer real-time ionospheric Modelling
Second layer ionospheric Modelling: historical plot-database
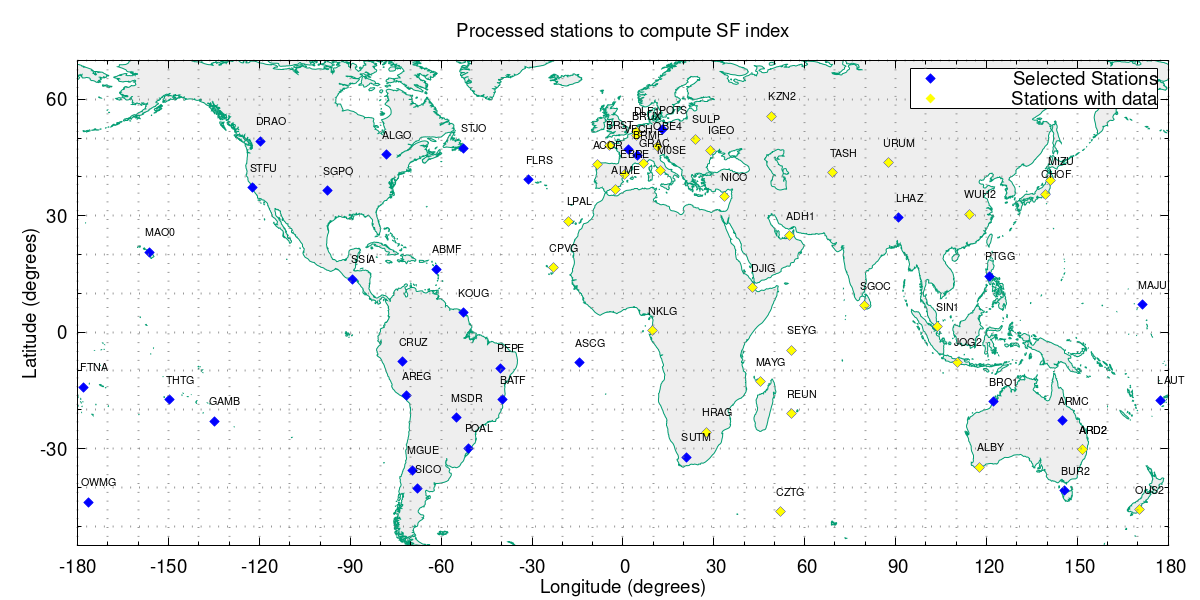
Other non-related monitoring products: Solar Flare Detection
Solar Flares (SF) refer to sudden increase of electromagnetic radiation from the sun
lasting from minutes to hours. The sudden increase of the energy emmitted by the sun produces an over-ionization
of the earth's ionosphere that can be measured using the resulting delays on the radiomagnetic signals of a global
network of GNSS dual-frequency receivers.
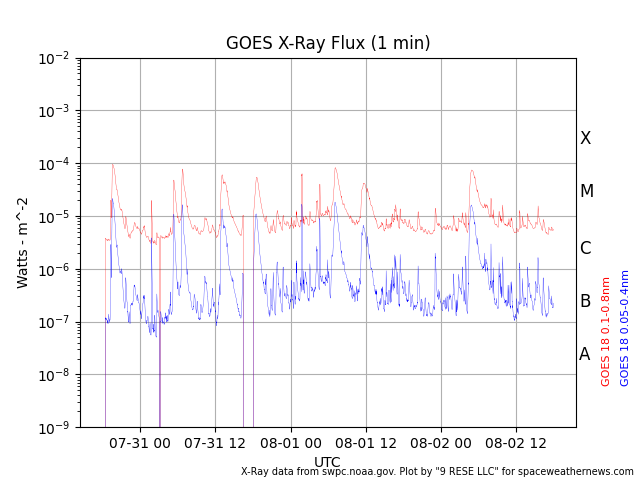
The following plots represent the real-time SF index during the current day, the set of stations implemented to compute
the index, and the reference data to compare with: the NASA GOES X-ray measurmenent
[Ref].

 "
"
click to see next plot.
Solar Flare Detector: historical plot-database